 The Kids' Guide to Emergency Savings
Guide published by Jose Abuyuan on September 13, 2020
Talking about money and savings are often reserved for grown up discussions. But even at an early age, it’s crucial to expose children to basic money management. Teaching kids how to budget and save may not seem very important when they’re young. However, as children grow, developing healthy financial habits can help them avoid toxic debt and other stressful money problems.
How does one prepare for financial setbacks? Learning how to save and budget are best cultivated at an early age. If kids start saving for emergencies early, they have better chances of recovering from a financial problem, especially during rough economic times in the future.
In this guide, we’ll discuss the state of financial literacy among children. Then we’ll move on to reasons why you should build emergency savings, such as the growing consumer debt in the U.S., and the trouble with high interest-debt such as credit cards. We’ll also talk about why people struggle with debt repayment, and different factors that can keep you from building savings.
Then, our guide will provide practical savings tips to manage your finances better. We also included links to financial literary lesson plans per grade level to teach your kids. We believe imparting basic financial principles can help children become wise and responsible consumers as they grow.
As this guide is detailed, you can read it linearly or jump to a section of interest using the table of contents.
How do children behave when it comes to money? Often, when parents give allowances to kids, it’s with the intent to teach saving.
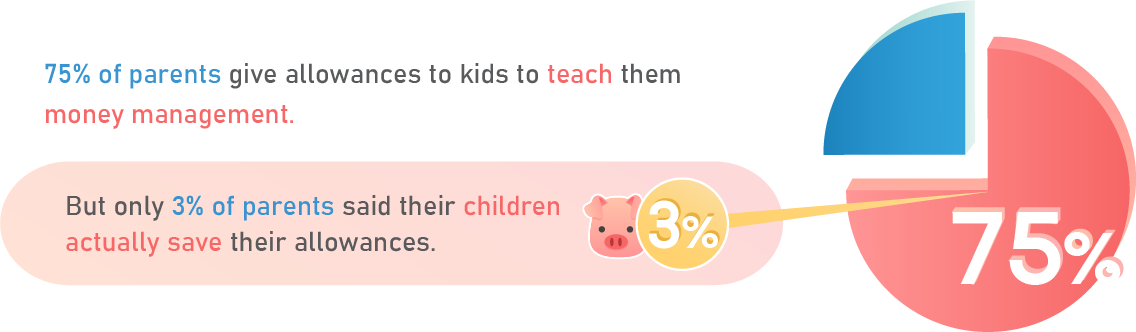
In October 2019, Consumer Affairs reported that 75 percent of parents say the most important reason for providing allowances to kids is to teach money management. However, in the same survey, only 3 percent of parents said their children actually save their allowances. The other 97 percent said they usually end up spending their money.
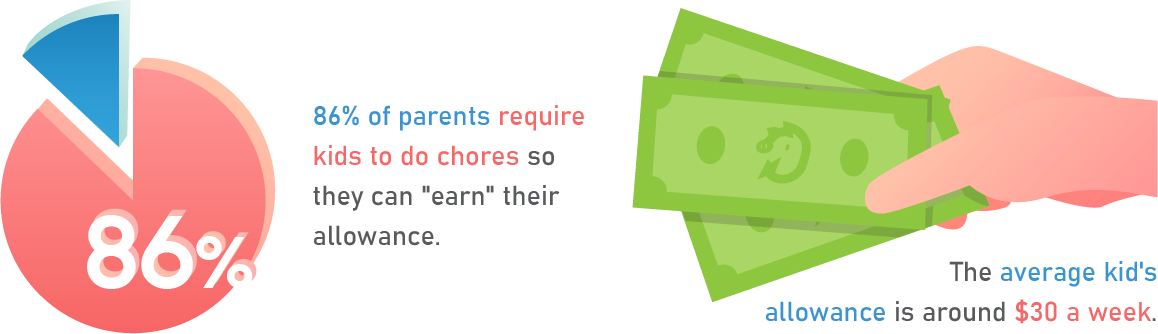
Moreover, 86 percent of parents in the survey said they don’t just give cash to kids. They require them to do chores so they can “earn it.” On average, a child’s allowance is around $30 a week. This data is based on a survey conducted by the Harris Poll for the American Institute of Certified Public Accountants (AICPA).
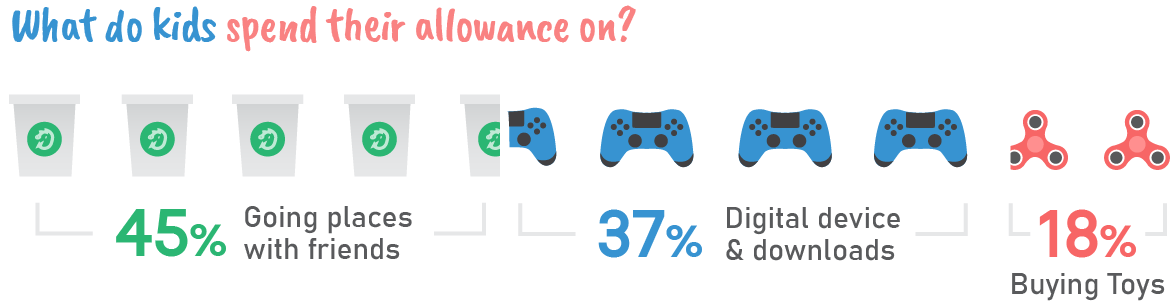
Here’s where children’s allowances usually go:
| % of Parents | What their kids spend allowance on |
|---|---|
| 45% | Going places with friends |
| 37% | Digital devices and downloads |
| 18% | Buying toys |
The purchases above fall under leisure and non-essential expenses. And since most of them do not save, it may indicate that kids are not yet taught about saving for emergencies and future needs. The data also shows that simply handing cash to kids without proper guidance is not enough.

Giving allowances should be a learning moment. Moms and dads should talk to kids about financial concepts when presented with the opportunity. Even when children become hardworking adults, saving and budgeting are primary financial skills that will help them conserve income.
In a related article, Policygenius wrote about how parents engage kids with money matters. In a June 2019 survey, they found that close to 63 percent of parents have discussed at least one major financial concept to their child. The survey was based on 1,500 parents with children below the age of 18 throughout the U.S.
When asked what financial concepts they’ve explained to their child, parents selected the following (multiple selections allowed):
| % of Parents | Financial Concept |
|---|---|
| 41.1% | Budgeting |
| 30.7% | Debt |
| 26% | Charity |
| 22.5% | Taxes |
| 16.3% | Credit scores |
| 16.2% | Insurance |
| 37.3% | None of the above |
Based on this data, budgeting and debt were the most frequently discussed financial concepts. This was followed by giving to charity and paying taxes. The concept of credit scores and insurance were the least discussed financial topics.
Under the topic of budgeting and debt, moms and dads can easily talk about the importance of emergency savings to kids. The concept of saving even a few dollars a week, as long as you do it consistently, can go a long way.
It’s important to stress that emergency savings must not be spent on any other expense, unless there is an actual emergency. On the other hand, credit scores, taxes, and insurance are topics that parents likely discuss when children are older.
Next, Policygenius found that over 47 percent of parents have not yet opened primary savings accounts or checking accounts for their child. When asked what financial accounts they have cosigned for their children, here’s what parents said:
| % of Parents | Type of financial account |
|---|---|
| 32% | Savings account |
| 17% | Checking account |
| 10% | Stocks, bonds or other investments |
| 7% | Credit card |
| 6% | Trust |
Parents can open traditional savings accounts or checking accounts for their child. This is a great way to encourage saving. It introduces kids formally to the banking system and even motivates them to keep saving money for the future. Other parents cosign trust funds, even stocks and investments for their kids.
Give your kids a head start with financial management. Start talking to your children about financial concepts early on, and encourage them to save their money. In the long-term, they will thank you for it.
The following sections will detail many important historical lessons and reasons why you should teach them young.
Household debt pertains to the combined debts of all the members living in a home. These usually include consumer debts such as mortgages, auto loans, and credit card debts. The U.S. household debt refers to the overall debts incurred by American consumers. To keep track of all these debts, the Federal Reserve Bank of New York updates their record every quarter.
Historically, people typically spend most of their income on buying a house. The rest is dedicated to other living necessities and wants. A report by CNBC states that people usually spend 10 percent of their disposable income on non-housing debts, such as credit card payments, car loans, and student loans. When more people take out loans, it signifies consumers are confident they can pay back lenders. However, if people incur more debt than they can pay on time, it becomes troublesome.
To date, Bloomberg reported that the U.S. household debt surpassed the $14 trillion mark for the first time in Q4 of 2019. Coming into 2020, the country faced economic challenges due to the impact of the coronavirus pandemic, with President Donald Trump declaring a national emergency in March 13, 2020.
Stay at home orders and enforced lock downs caused widespread unemployment in many industries. Some of those most affected were the food industry, service workers, and airline companies. When states reopened in May 2020, the Washington Post reported that the unemployment rate rose to 13.3 percent.
By the end of Q1 in 2020, U.S. household consumer debt grew to $14.30 trillion, which is a 1.1 percent increase from Q4 of 2019. According to the New York Fed’s report, while housing debt increased together with student loans and auto debt, consumers showed a significant decline in credit card balances.
This apparent decrease in credit card spending may reflect the early impact of the coronavirus crisis on consumers. With unemployment and reduced salaries, people are obliged to reduce expenses till they find stable sources of income.
The table below breaks down debt categories from the previous quarter and Q1 of 2020.
U.S. Household Debt Figures, Q4 2019 – Q1 2020
| Household Debt | Quarterly Change | Q4 2019 | Q1 2020 |
|---|---|---|---|
| Mortgage | (+) $156 billion | $9.56 trillion | $9.71 trillion |
| HELOC | (-) $4 billion | $0.39 trillion | $0.39 trillion |
| Student Debt | (+) $27 billion | $1.51 trillion | $1.54 trillion |
| Auto Debt | (+) $15 billion | $1.33 trillion | $1.35 trillion |
| Credit Card Debt | (-) $34 billion | $0.93 trillion | $0.89 trillion |
| Other | (-) $5 billion | $0.43 trillion | $0.43 trillion |
| Total Household Debt | (+) $155 billion | $14.15 trillion | $14.30 trillion |
Data from the Federal Reserve Bank of New York
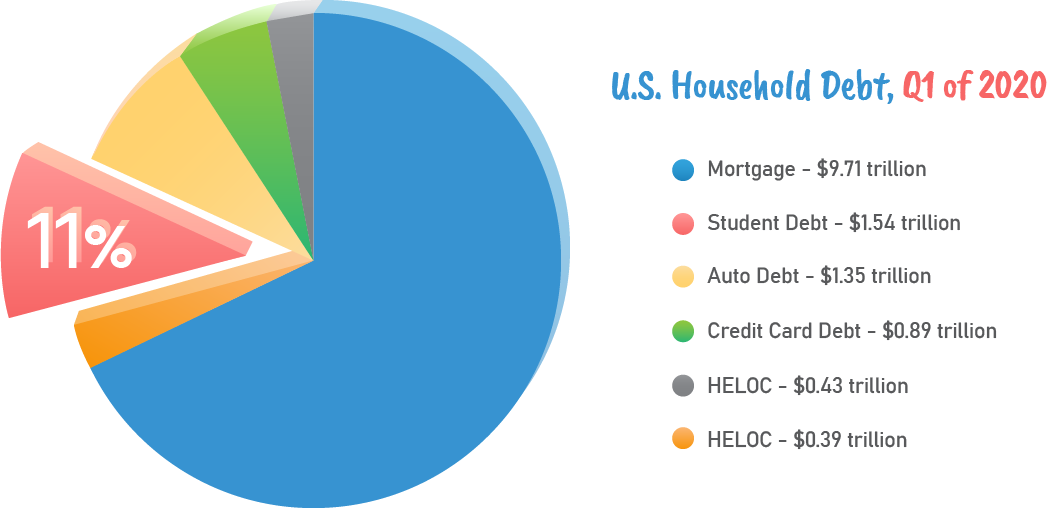
In Q1 of 2020, mortgages took the largest share of consumer debt with $9.71 trillion. Second comes student loan debt at $1.54 trillion, at third are auto loans at $1.35 trillion. In fourth place is credit card debt with approximately $1.35 trillion. Other debts such as personal loans came in at fifth place with $0.43 trillion, while home equity lines of credit (HELOC) took the last spot with $0.39 trillion.
In Q1 of 2020, many consumers unfortunately fell into serious delinquency. These are people unable to pay their loans for 90 days or more. The total delinquency rate in Q4 of 2019 was 2.36 percent, and it rose to 2.38 percent in Q1 of 2020. See the tables below:
U.S. Consumer Flow Into Serious Delinquency (90 days and up)
| Household Debt | Q4 2019 | Q1 2020 |
|---|---|---|
| Mortgage | 1.10% | 1.17% |
| HELOC | 0.85% | 0.77% |
| Student Debt | 9.21% | 8.87% |
| Auto Debt | 2.36% | 2.37% |
| Credit Card Debt | 5.32% | 5.31% |
| Other | 4.70% | 4.74% |
| All debts | 2.36% | 2.38% |
| Debt Category | U.S. Q1 2020 Delinquencies |
|---|---|
| Mortgage debt | Around 0.9% of existing mortgage balances were delinquent for 30 days or more. Around 75,000 people got new foreclosure notations on their credit reports from January 1 – March 31. |
| Student debt | Approximately 10.8% of aggregate student loan debt was 90 or more day delinquent or in default. |
| Auto debt | Around 2.37% of consumers became 90 or more days delinquent in auto loan payments. This is a slight increase from 2.36% in Q4 of 2019. |
| Credit card debt | Around 5.31% of credit card holders became 90 or more days delinquent with payments. This is a slight decrease from 5.32% in Q4 of 2019. People were less likely to use their credit cards. |
Data from the Federal Reserve Bank of New York
Delinquency occurs when you do not have enough financial cushion to cover loan payments during emergencies. While struggling to make ends meet, people who lack funds tend to incur late loan payments.
Many factors can result in substantial loss of income. These include losing your job or adjusting to a reduced salary during a recession. You may even catch a severe illness or get into an accident, which racks up expensive medical bills. Thus, when faced with emergencies, if you do not have enough savings, it’s tough to keep your living situation afloat.
There are many factors that can keep people from paying debts, much less build substantial savings. Indeed, overspending is an issue. Living in a consumerist culture where people are pressured to have the same things or “better” may drive people into further debt. And if you don’t know how to plan for major purchases, like buying a house or a car, you might end up with a bad deal.
Apart from lack of budgeting skills, other important costs have risen much faster than people’s wages. These growing expenses include college education and healthcare.

According to U.S. News in 2019, the cost of sending kids to college grows more expensive every year. Even before adults are ready to purchase a house, they have to worry about student debt. Besides the rising tuition, students need to pay for food, housing, transportation, books, and other related fees. These add up to thousands of dollars a year. To lower education expenses, families would send their sons and daughters to in-state colleges. However, in the last 20 years, tuition costs for private and public National Universities have increased a great deal.
Bloomberg notes that student debt has steadily become the second largest consumer debt in America next to housing loans. Student loans began as the lowest shareholder of household debt in 2003. But by 2010 to 2019, it has overtaken auto loans as the largest non-housing debt in the U.S.
In 2019, U.S. News included tuition fee data from 381 ranked National Universities in their 2020 Best Colleges report, which underscores these key findings:
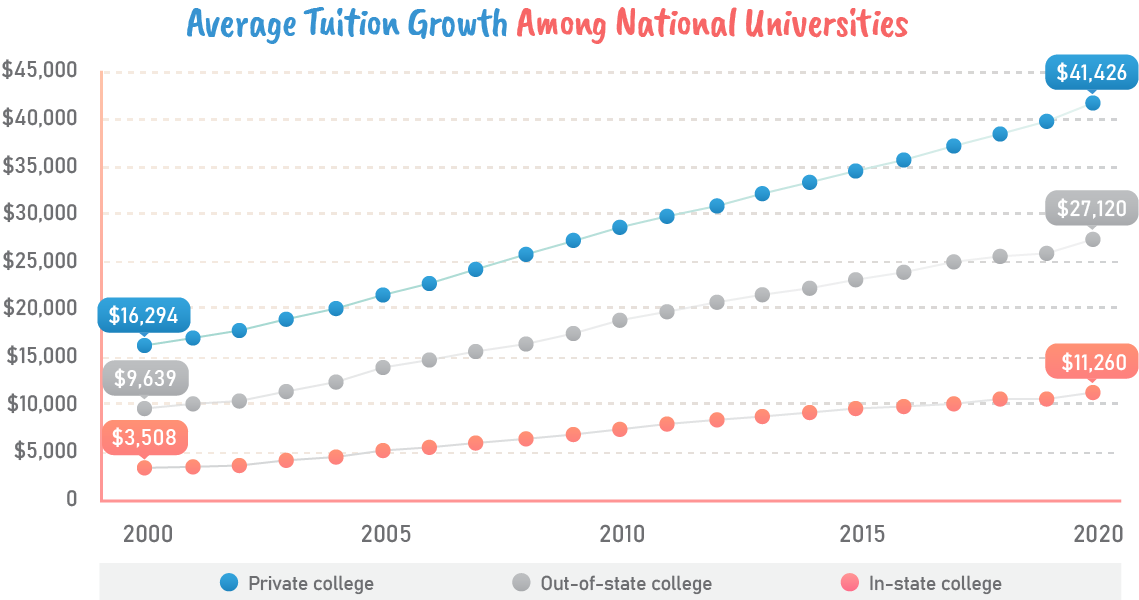
Here’s data that illustrates average tuition fees per year, from 2000 to 2020. It includes private colleges, out-of-state colleges, and in-state colleges. Notice how fast education cost increased in the past 20 years. (U.S. News included data to reflect tuition fee increase in 2020).
Average College Tuition Growth (National Universities), 2000-2020
| Year | Private | Out-of-state | In-state |
|---|---|---|---|
| 2000 | $16,294 | $9,639 | $3,508 |
| 2001 | $16,987 | $10,101 | $3,583 |
| 2002 | $17,938 | $10,409 | $3,738 |
| 2003 | $19,009 | $11,413 | $4,202 |
| 2004 | $20,150 | $12,404 | $4,633 |
| 2005 | $21,476 | $13,903 | $5,275 |
| 2006 | $22,738 | $14,719 | $5,642 |
| 2007 | $24,243 | $15,568 | $6,189 |
| 2008 | $25,664 | $16,454 | $6,505 |
| 2009 | $27,146 | $17,487 | $6,891 |
| 2010 | $28,452 | $18,769 | $7,472 |
| 2011 | $29,514 | $19,644 | $7,927 |
| 2012 | $30,658 | $20,653 | $8,417 |
| 2013 | $31,882 | $21,539 | $8,860 |
| 2014 | $33,153 | $22,199 | $9,229 |
| 2015 | $34,344 | $23,172 | $9,602 |
| 2016 | $35,561 | $23,937 | $9,809 |
| 2017 | $36,898 | $24,847 | $10,135 |
| 2018 | $38,261 | $25,453 | $10,548 |
| 2019 | $39,513 | $25,752 | $10,655 |
| 2020 | $41,426 | $27,120 | $11,260 |
Data from U.S. News
On the other hand, the next graph shows how workers’ annual wage net compensation changed from 2000 to 2018. This is according to the Social Security Administration (SSA) Measures of Central Tendency for Wage Data. It includes the average net compensation together with the median net compensation for workers.
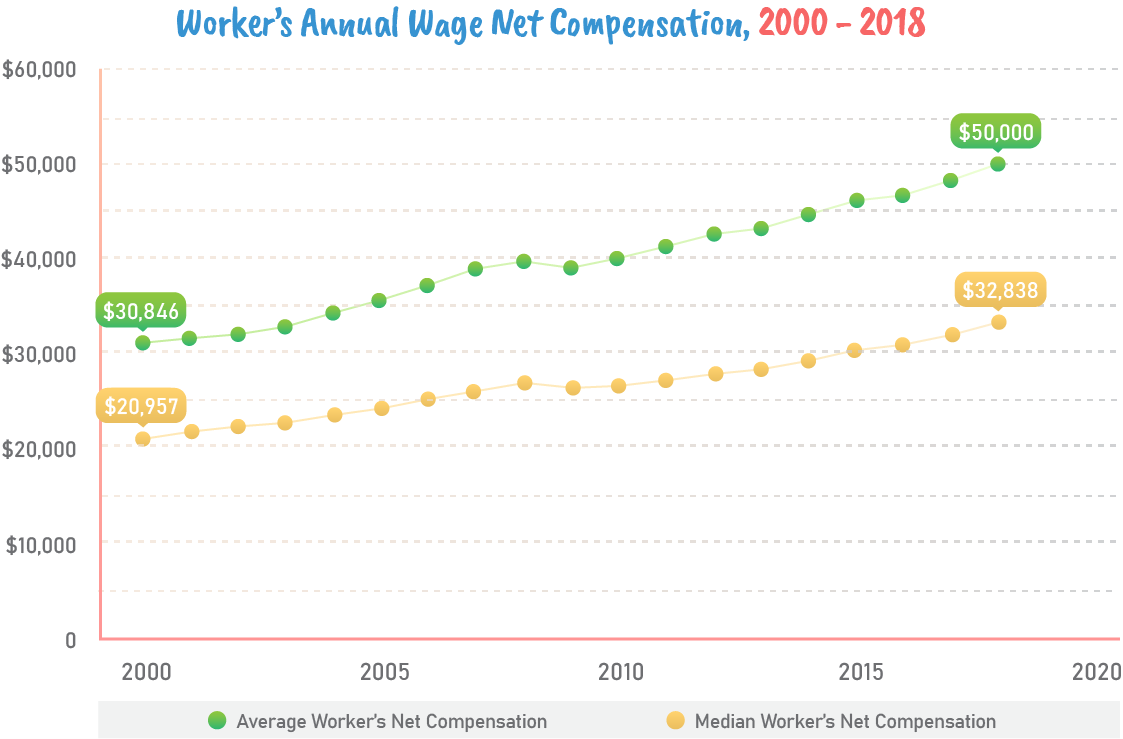
Since the average is just one way to measure central tendency, the SSA also took the median wage. This is the middle amount, from where one half earns the lowest, and the other half earns the highest. The median is shown because the distribution of workers’ wage levels highly vary. Our graph above and the table below shows how median wage is considerably lower than the average wage.
| Year | Average Net Compensation | Median Net Compensation | Difference | % Avg Above Median |
|---|---|---|---|---|
| 2000 | $30,846.09 | $20,957.18 | $9,888.91 | 47.19% |
| 2001 | $31,581.97 | $21,767.29 | $9,814.68 | 45.09% |
| 2002 | $31,898.70 | $22,152.84 | $9,745.86 | 43.99% |
| 2003 | $32,678.48 | $22,576.71 | $10,101.77 | 44.74% |
| 2004 | $34,197.63 | $23,355.83 | $10,841.80 | 46.42% |
| 2005 | $35,448.93 | $23,962.20 | $11,486.73 | 47.94% |
| 2006 | $37,078.27 | $24,891.59 | $12,186.68 | 48.96% |
| 2007 | $38,760.95 | $25,737.20 | $13,023.75 | 50.60% |
| 2008 | $39,652.61 | $26,514.38 | $13,138.23 | 49.55% |
| 2009 | $39,054.62 | $26,261.29 | $12,793.33 | 48.72% |
| 2010 | $39,959.30 | $26,363.55 | $13,595.75 | 51.57% |
| 2011 | $41,211.36 | $26,965.43 | $14,245.93 | 52.83% |
| 2012 | $42,498.21 | $27,519.10 | $14,979.11 | 54.43% |
| 2013 | $43,041.39 | $28,031.02 | $15,010.37 | 53.55% |
| 2014 | $44,569.20 | $28,851.21 | $15,717.99 | 54.48% |
| 2015 | $46,119.78 | $29,930.13 | $16,189.65 | 54.09% |
| 2016 | $46,640.94 | $30,533.31 | $16,107.63 | 52.75% |
| 2017 | $48,251.57 | $31,561.49 | $16,690.08 | 52.88% |
| 2018 | $50,000.44 | $32,838.05 | $17,162.39 | 52.26% |
The data above was taken from the SSA, where the figures were based on the national average wage index. This indicator is used to gauge workers’ general rise in standard of living.
Average wages rose slower than major living costs and median wages are rising even slower. People at the lower end of the economic spectrum fared worse during the recent recession with nearly 40% of low-income Americans losing their jobs during the COVID-19 pandemic.
If we juxtapose the average annual compensation with tuition fee increases, we’ll notice that a substantial part of annual wages can easily be taken by college expenses. For instance, in 2001, the average annual net compensation was $31,581.97. If you send your teen to a private college, it would cost you $16,987 a year. That’s already more than half of your annual compensation. If you choose an out-of-state college, it would cost $10,101 per year, which is more affordable. But if you opt for an in-state college, it would only cost $3,508, which is one-fourth as costly as a private college.
By 2018, the average annual compensation rose to $50,000.44. However, if you send your teen to a private college, it would cost $38,261 a year, which is around 78 percent of your annual compensation. Meanwhile, sending your child to an out-of-state college would cost $25,453 per year, which is half of your annual salary. And while in-state education is priced lower than private and out-of-state colleges, it costs $11,260 in 2018. That’s over three times more expensive than the average in-state college cost in 2000. If your income is lower than the average individual, you would likely have a harder time paying for college tuition.
For the following graph, we took the median annual compensation and plotted it together with private school and in-state college tuition costs. It gives us a better idea of how much lesser people earn over the past few years in comparison to the rising cost of education.
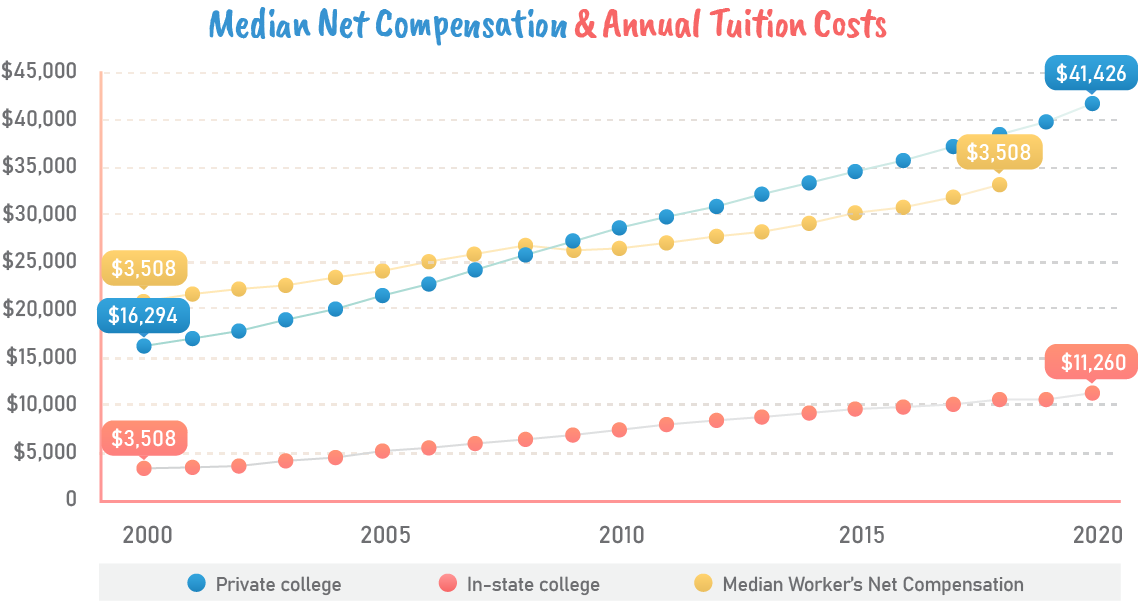
Based on the graph above, the median annual compensation started off at $20,957.18 in 2000, which is higher than the average private school tuition at $16,294. However, by 2008, private college tuition rose to $25,664, while the median annual compensation was just at $26,514.38. In 2009, private school tuition overtook the annual median salary, which is $27,146 over $26,261.29.
Seeing this trend, a parent with a median salary cannot afford to send their teen to a private college. Therefore, they must be able to send their teen to an in-state college. In-state college tuition in 2018 reached $10,655, while annual median compensation was at $32,838.05. Choosing an in-state college gives parents more financial leeway for other important costs. Though it’s a viable option, it effectively limits your child’s school preferences.
Unless you have ample savings, it’s a struggle to afford college expenses. This is especially difficult if you have high credit card debt and a mortgage to take care of. As a recourse, many people apply for student loans, which may take them 10 or 20 years to pay off.
Compared to other countries, the U.S. spends substantially more on healthcare. Such spending is also predicted to keep on rising, which inevitably aggravates America’s growing debt problem.
In 2018, the Centers for Medicare and Medicaid Services (CMS) reported that the U.S. spent around $3.6 trillion on healthcare. This is equivalent to about $11,172 per person a year. The cost of healthcare also grows relative to the size of the economy. In 1960, it accounted for 5 percent of the gross domestic product (GDP). By 2018, healthcare expenditures accounted for 17.7 percent of the GDP.
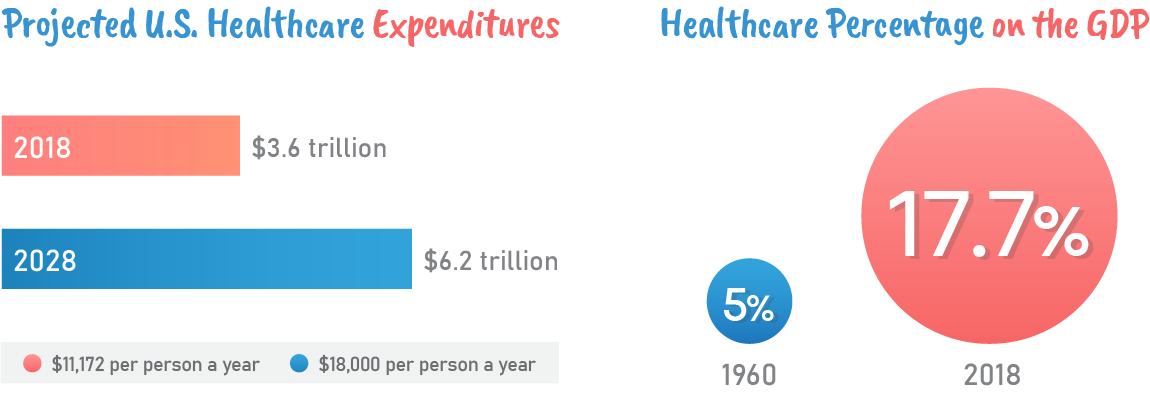
Moreover, the CMS projects that medical costs will rise to $6.2 trillion in 2028. That’s around $18,000 per person annually. This does not account for the Covid-19 pandemic’s financial impact yet. Experts anticipate Covid-19 treatment costs to be expensive, which can drive healthcare costs even higher.
U.S. healthcare costs are associated with the function of the dollar price and utilization. These refer to the amount charged in exchange for healthcare services, and the amount of healthcare services consumers use. Several factors can increase price and utilization, driving healthcare expenditures higher. In 2019, the Journal of the American Medical Association (JAMA) published a study that notes five factors that influence the cost of healthcare. These include:
One of the key factors is the growing population. More people increase the demand for healthcare services. People with unhealthy lifestyles—those with bad diets who do not get enough exercise—are also prone to illness. For instance, eating a diet high in sugar and carbohydrates causes weight gain and inflammation in the body. Over time, bad health can get very expensive.
If you don’t change your diet, your joints can eventually wear out. As you age, you’ll have a hard time walking. The lack of mobility makes it harder for your to exercise, which can progress to more serious health conditions such as heart disease, hypertension, and diabetes. Over time, your medical expenses get higher as your health fails to improve.
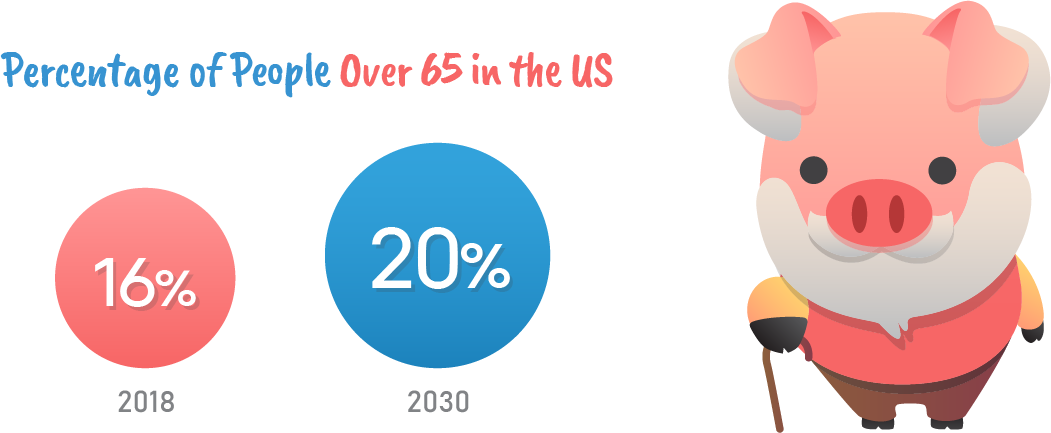
When the aging population grows, more people are likely to seek medical care. The U.S. Census Bureau states that people aged 65 and above comprised 16 percent of U.S. population in 2018. This figure is expected to surpass 20 percent by 2030. On average, people over 65 years old spend more on medical costs than any other age group. Since diseases like heart problems, diabetes, and cancer are more prevalent among seniors, they tend to spend more on medical treatment. The growing elderly population is anticipated to increase healthcare prices over time.
Medical service utilization is affected by the patients’ ability to access healthcare. This is associated with a patient’s geographical area, age, gender, disability status, and even ethnicity. If medical care is not widely available in a certain location, it impacts healthcare utilization, making it more costly to access for patients. Americans also tend to pay more for administrative costs related to the complexity of the country’s heath care system.
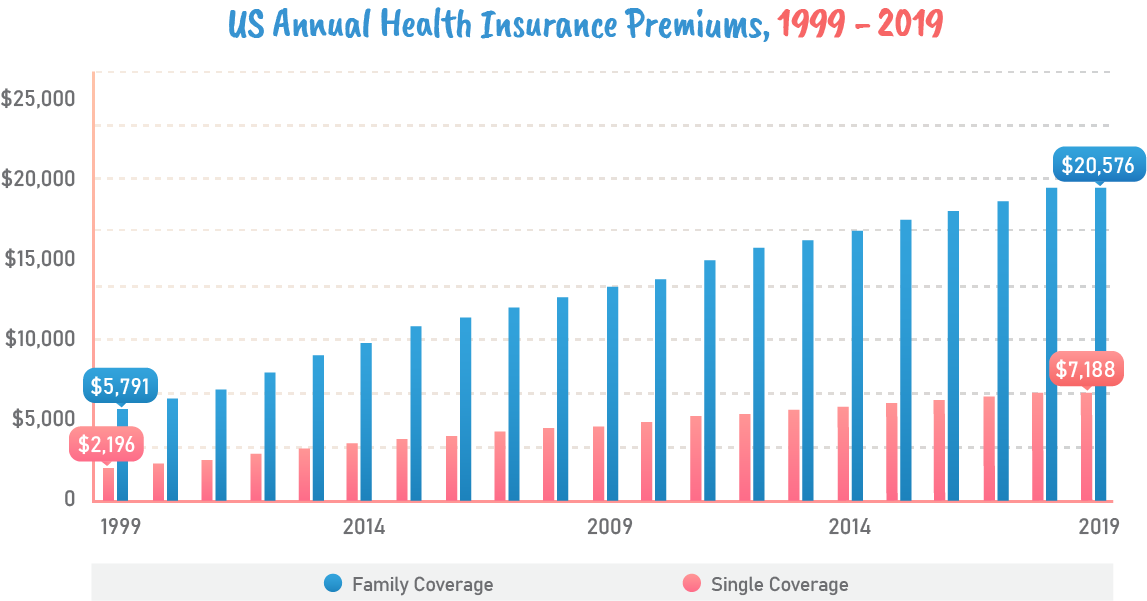
The Kaiser Family Foundation (KFF) states that the average annual premium for a family healthcare coverage was $20,576 in 2019. That’s a 5 percent increase from $19,616 in 2018. To show how insurance premiums have grown over 20 years, here’s a chart that details changes in health insurance premiums for single coverage and family coverage. It includes average annual premiums from 1999 to 2019.
| Year | Single Coverage | Family Coverage |
|---|---|---|
| 1999 | $2,196 | $5,791 |
| 2000 | $2,471 | $6,438 |
| 2001 | $2,689 | $7,061 |
| 2002 | $3,083 | $8,003 |
| 2003 | $3,383 | $9,068 |
| 2004 | $3,695 | $9,950 |
| 2005 | $4,024 | $10,880 |
| 2006 | $4,242 | $11,480 |
| 2007 | $4,479 | $12,106 |
| 2008 | $4,704 | $12,680 |
| 2009 | $4,824 | $13,375 |
| 2010 | $5,049 | $13,770 |
| 2011 | $5,429 | $15,073 |
| 2012 | $5,615 | $15,745 |
| 2013 | $5,884 | $16,351 |
| 2014 | $6,025 | $16,834 |
| 2015 | $6,251 | $17,545 |
| 2016 | $6,435 | $18,142 |
| 2017 | $6,690 | $18,764 |
| 2018 | $6,896 | $19,616 |
| 2019 | $7,188 | $20,576 |
Data from the KFF Employer Health Benefit Survey 2018-2019, Kaiser/HRET Survey of Employer Sponsored Health Benefits, 1999-2017
Based on the figures above, health insurance started at $2,196 for single coverage and $5,791 for family coverage in 1999. The coverage for families increased a lot faster compared to its individual counterpart. By 2019, family health insurance premiums were almost three times more expensive than single coverage plans. Single coverage costs rose to $7,188, while family coverage increased to $20,576. KFF states that the average family healthcare premium has grown by 54 percent between 2009 to 2019.
Now, if we plot the average and median annual net compensation together with health insurance for families, we’ll see that a considerable portion of annual salary goes towards health insurance. This does not factor other possible medical emergencies or illness you might face yet. See the graph below.
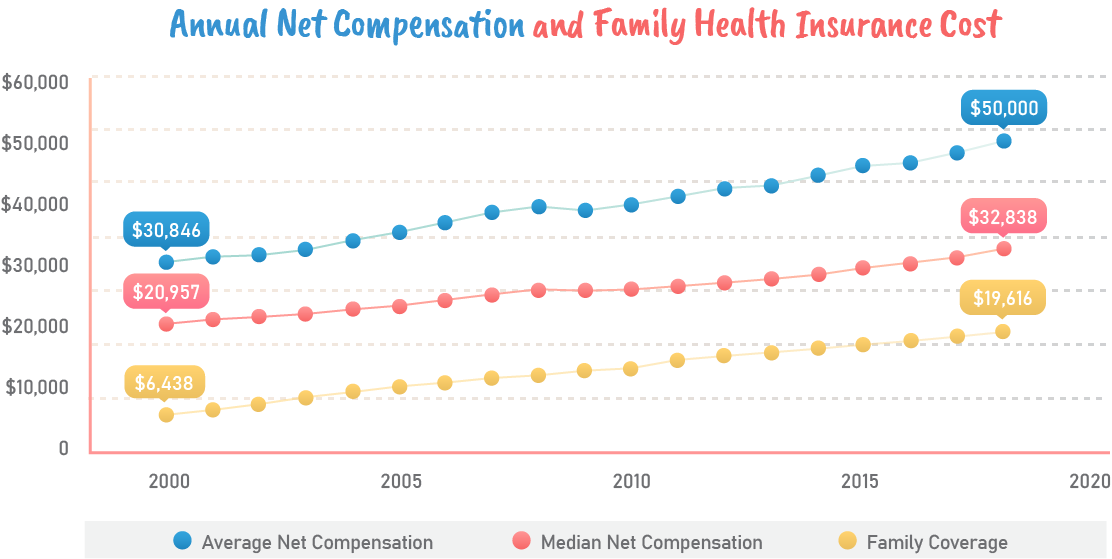
In 2000, the average annual net compensation was $30,846.09, while median net compensation was $20,957.18. The average annual family insurance cost was $6,438 in 2000, which is 20 percent of the average salary and around 30 percent of the median salary. That’s a substantial amount, especially if you happen to fall under a median salary.
Fast forward to 2010, the average annual net compensation rose to $39,959.3, and the median net compensation grew to $26,363.55. Despite rising wages, the average family health insurance cost was at $13,770 a year, which is 34 percent of the average net salary, and 52 percent of the median net salary. The higher percentages indicate that wages did not rise fast enough to match the same percentage in 2000.
By 2018, family insurance increased to an average of $26,363. This is around 52 percent of the average annual compensation in 2018, which is $50,000.44. Meanwhile, the median salary was $32,838.05, making family insurance over 80 percent of the annual median compensation. The data shows that unless wages rise faster, or healthcare costs become more affordable, more Americans will have a hard time affording required health insurance in the future.
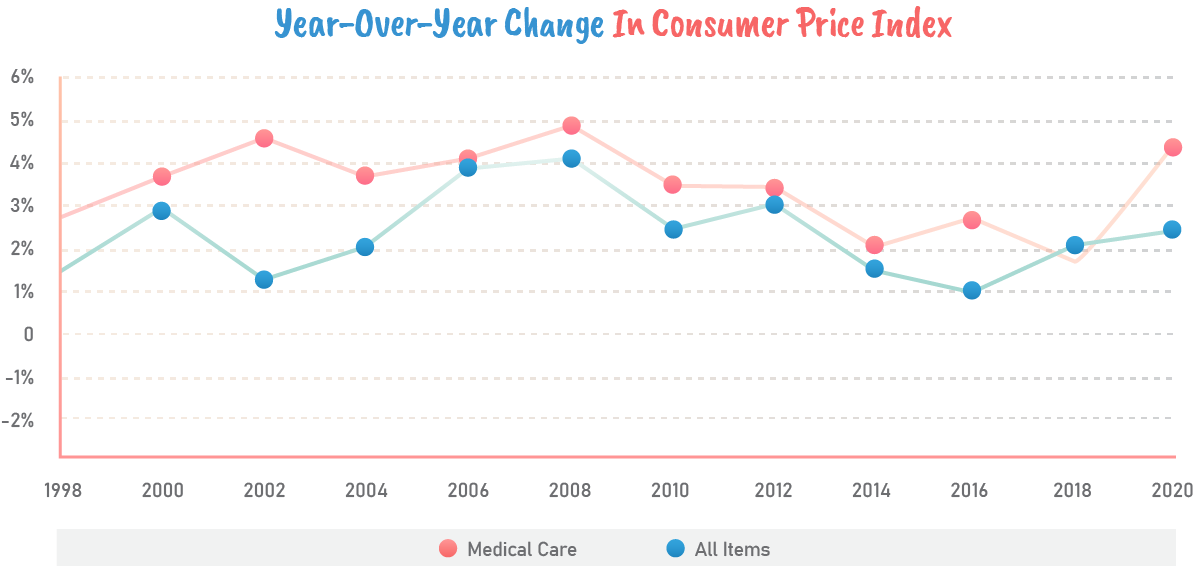
Furthermore, research by PGPF states that the cost of healthcare services has risen faster than other goods and services in the country. In the last 20 years, the Consumer Price Index (CPI), which is the indicator for the average price changes paid by urban consumers, has increased every year at an average of 2.1 percent. Meanwhile, the cost of healthcare has grown at an average of 3.5 percent annually. This is substantially higher, which may discourage people from seeking medical care as they worry about the cost.
PGPF’s graph below illustrates the disparity between the cost of common consumer goods and medical care.
Education and healthcare expenses are just examples of important cost you have to prepare for. Even the price of basic goods and services rise every year, which is referred to as the inflation price. Imagine how much money you’ll need to save to cover basic necessities like food, transportation, and your rent or mortgage.
Even if it fits your finances, what if unexpected costs derail your budget? You’ll have a hard time repaying debt, let alone saving money. But if you save a lot earlier and teach your kids to do the same, your family will have a better financial safety net in case of emergencies.

Using credit cards for certain expenses is helpful, especially during unexpected situations such as emergency car repairs or emergency medical treatment. It gives you access to cash which you can later pay back. However, if you regularly use your credit card without clearing your balance, you’ll soon get caught in a debt trap. Once you incur toxic debt, it’s a nightmare that’s hard to escape.
Creditcards.com states that in 2019, around 37 percent of U.S. households had credit card debt carried over from month to month. The average credit card balance throughout the country reached $6,194 in Q2 of 2019. In some states with higher cost of living such as Alaska, the average credit card debt rose to $8,026.
The graph below illustrates how high delinquency rates are for U.S. borrowers aged 18 to 29 compared to all other U.S. borrowers. It shows rates from Q1 2009 to 2019.
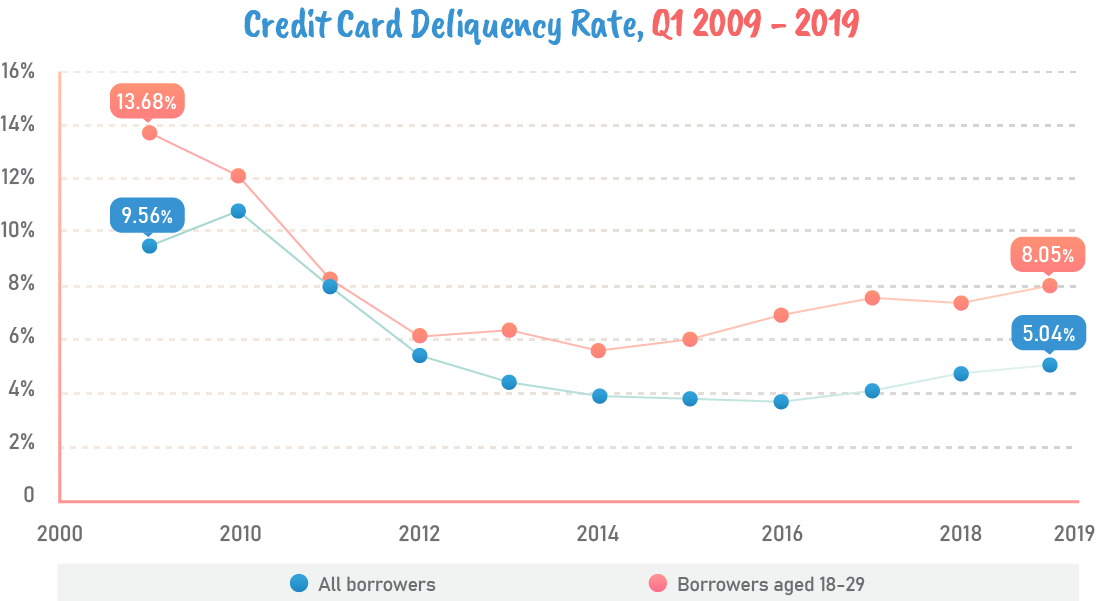
U.S. Credit Card Delinquency Rate, 2009-2019
| Q1 Year | All borrowers | Borrowers aged 18-29 |
|---|---|---|
| 2009 | 9.56% | 13.68% |
| 2010 | 10.8% | 12.13% |
| 2011 | 7.99% | 8.29% |
| 2012 | 5.41% | 6.11% |
| 2013 | 4.41% | 6.32% |
| 2014 | 3.87% | 5.59% |
| 2015 | 3.76% | 6.03% |
| 2016 | 3.69% | 6.93% |
| 2017 | 4.08% | 7.53% |
| 2018 | 4.72% | 7.34% |
| 2019 | 5.04% | 8.05% |
Data from the Federal Reserve Bank of New York
By Q4 of 2019, serious delinquency rate for all borrowers increased to 5.32 percent from 5.16 percent in the previous quarter. On the other hand, the serious delinquency rate for borrowers aged 18 to 29 years old rose to 9.36 percent in Q4 of 2019. This is the highest since Q4 of 2010 from 8.9 percent.
The data shows that many young credit card users did not prioritize clearing their balance early on. It can also indicate they use revolving credit to afford things beyond their means. And when faced with economic crisis like job loss, they are bound to have a harder time making payments. Either way, young consumers need to improve their financial management and build savings to steer clear of toxic debt.
On top of the large balance, credit card lenders charge for late fees. Late fees can range from $28 to $39. If you are unable to make the minimum payment within 60 days of the due date, credit card companies can increase your prime rate, which increases your interest rate. This is a penalty for not paying on time. The credit card penalty rate is usually around 29.99%, which puts a massive increase on your payment. Making late payments also affects your credit report negatively.
The annual fee, on the other hand, is the amount you pay each year for using your credit card. Some providers waive the annual fee on the first year, but charge it in the succeeding years. Annual fees can be as small as $49 to as high as $550. But on average, most annual fees are around $100. Premium credit cards for traveling typically have the highest annual fees.
Unless you’re a responsible credit card holder, it’s easy to accumulate an exorbitant amount of debt. Swiping plastic is tempting when you can buy almost anything and pay for it later. But this comes with a price, which is charged in the form of interest rates. In August 5, 2020, the average interest rate on a credit card was 16.03 percent, according to Creditcards.com.
Interest is the amount your bank charges to service your credit card balance. If you carry over balance from month to month, your interest charges grow higher. Credit card interest rates are typically higher compared to consumer debt such as mortgages and car loans. This is because credit cards are considered unsecured debt, which are not tied to collateral like a house or any other asset. And with credit card use, you have to watch out for the impact of compounding interest.

Famed theoretical physicist Albert Einstein considered compound interest one of the most powerful concepts invented by man. Whether this urban legend is true or not, understanding the advantages of compound interest is crucial. This principle makes owing debt stressful for borrowers, yet highly profitable to lenders. If you have a savings account, you can use compound interest to substantially grow your savings.
Compound interest is interest that grows based on the original interest and principal of a loan. It occurs when interest is added on the principal balance after which the interest rate is applied to the new principal, resulting in a higher amount. The frequency of compounding interest is what increases the balance.
Compound interest applies to savings accounts and investments, and can totally turn against you if you’re paying loans or credit cards. If you have high-interest credit card with a large balance, compounding interest explains why it’s a struggle to pay it down.
Even poor health exacts compound interest on your finances. When a person’s condition gets progressively worse, they tend to spend more on medical care. The Centers for Disease Control and Prevention (CDC) states that approximately 88 million adult Americans are prediabetic. It’s a serious health condition where your blood sugar is higher than normal but not yet high enough to be type 2 diabetes.
Aside from type 2 diabetes, prediabetic patients have higher risk of developing heart disease and stroke. Having chronically elevated levels of inflammation can increase the risk of cancer and other aging-related diseases. With so many Americans succumbing to poor health, it’s no wonder people struggle to keep up with expensive medical-related debt. Thus, maintaining a healthy diet and regular exercise is a must as you age.
What happens when you carry over credit card debt every month? Borrowers must pay interest charges on top of their balance, which is based on their credit card’s annual percentage rate (APR). The interest keeps earning as long as you do not pay off your credit card balance.
According to Experian, credit card interest is based on your account’s average daily balance during your statement period, which is compounded daily. This means your lender multiplies each day’s average daily balance by your account’s daily periodic rate. The resulting amount is added the following day to your average daily balance. This cycle repeats itself until you clear off your debt.
How does this impact your account? If you have a modest credit card balance and an average APR, the impact of daily compounding is minor over a period of a month. However, if you have a high interest rate and a large balance, compounding interest is evidently felt with much higher interest charges. Likewise, the interest charges get higher the longer it takes to pay down credit card debt.
Credit card providers use low minimum payments as a marketing ploy to attract consumers. This gives the false idea that you can keep swiping your credit card without consequences. But in reality, minimum payments drive people further into debt. Banks allow consumers to pay as low as 1 to 3 percent of the balance, which is not enough to reduce their debt.
For example, if your balance is $5,600, paying just 3 percent of your balance each month will take you over 17 years to pay it off. You’ll spend more on interest than repaying the actual balance. For this reason, it’s wiser to make fixed payments with a higher amount to reduce your debt. You can use our fixed vs. minimum credit card payment calculator to estimate your monthly payment.

When used for savings, compound interest yields higher returns. You can use this principle to build your emergency funds. Banks advertise high annual percentage yields (APY) to attract more people to open high-interest savings accounts. The APY indicates the rate of return per year, which depends on the interest rate and how frequently the interest compounds. When interest is compounded more times, it helps boost your savings faster.
For example, if your savings account comes with 2 percent APR, you are paid 2 percent when your interest compounds on an annual basis. If your interest compounds on a quarterly basis, the 2 percent is divided into four to cover four quarters of a year. In this case, you’re paid 0.5 percent four times a year.
The key to children and money is explaining what it is to them very early in life. Money is not free, it doesn’t grow on trees, and the concept of working for it is very important. You spend your time to make money.
Kevin O’Leary, from the CNBC Make It interview
To give you a better idea, the following example shows how interest grows based on different compounding frequency schedules. Let’s say you made a $5,000 deposit at 2 percent APR for 5 years.
Principal deposit: $5,000
Interest rate: 2% APR
Investment term: 5 years
| Frequency | APR | APY | Interest earned | Future savings |
|---|---|---|---|---|
| Annual | 2% | 2.000000% | $520.40 | $5,520.40 |
| Quarterly | 2% | 2.015050% | $524.48 | $5,524.48 |
| Monthly | 2% | 2.018436% | $525.39 | $5,525.39 |
| Daily | 2% | 2.020078% | $525.84 | $5,525.84 |
Based on the table, your savings earn the most under daily frequency, which increases to $5,525.84 in five years. Annual frequency earns the least, which grows to $5,520.40 after five years. You earn greater interest if you make a larger initial deposit or continue to make monthly deposits on your savings account.
To learn more about compound interest and how it’s estimated, visit our guide on our compound interest calculator.
For the next example, let’s say you plan to deposit $50 each month to your account. Here’s how much faster your savings will grow.
| Frequency | APR | APY | Interest earned | Future savings |
|---|---|---|---|---|
| Annual | 2% | 2.000% | $642.83 | $8,642.83 |
| Quarterly | 2% | 2.015% | $671.35 | $8,671.35 |
| Monthly | 2% | 2.018% | $677.76 | $8,677.76 |
| Daily | 2% | 2.020% | $680.88 | $8,680.88 |
Again, daily frequency yields the most returns, increasing your savings to $8,680.88 after five years. Meanwhile, annual frequency earns the least returns, growing your balance to $8,642.83 in five years. The larger deposits you make, the higher interest your account earns.
Now that you know how compound interest works, it makes better sense to open a high-interest savings account. Make deposits frequently to build your savings. Most of all, steer clear of compound interest when it comes to loans, especially high-interest debt such as credit cards. Always pay your credit card on time to avoid penalties that increase your rates.
Emergency funds are cash reserves set aside for sudden unplanned expenses and emergencies. In order to build emergency funds, you must avoid touching a single cent in this account. Remember: emergency funds cannot be spent for discretionary purchases.
Common emergency situations that can arise include accidents or illness, car repairs, and home repairs. Now and then, you might need emergency plumbing, or a broken appliance needs changing. In other cases, you might be faced with sudden unemployment, which entails a huge loss of income.
The following are different types of emergencies and how they can impact your finances:
Emergency savings help buffer financial loss so you can recover faster. This way, you don’t have to rely on credit cards or loans that are much harder to pay back. This is why parents should teach kids to avoid accumulating large debt at an early age.
For others, setting aside 3 months of income may be hard. This happens when you’re the only bread winner in the family, or when you’re faced with large debts. However, Experian states even saving one month’s expenses is better than having no emergency savings at all. If a month’s living cost is $3,500, this amount can still cover sudden repair jobs or medical emergencies.
Next, setting aside small bills whether it’s $5 or $20 still go a long way. Try to dedicate even a small amount to emergency savings every month. For instance, $20 a month can save you an extra $240 a year. If you save $40 a month, that’s an extra $480 a year. No matter how little, your money will grow as long as you set it aside without spending.
Savings start with the first dollar. When you give your kid allowance, always impress the value of setting aside a portion of their money. And often, being a good example yourself will encourage them to emulate good saving habits.
Here’s how you can teach your child. If you give them a $10 a week, encourage them to save at least $3 a week. Tell them they can save $12 a month, which grows to $144 a year if they keep saving. And as an incentive, you can add several dollars each month, say $6, if they save $12, which is a great way to teach compound interest. By the end of the year, their savings will grow to $216. Of course, if they save more than $12 a month, their savings will grow larger.
Now, it might be overwhelming to think you should save a large sum. But if you take it step by step, it makes the process a lot easier. Building funds is more manageable if you save in increments. Follow these steps to grow your emergency savings:
Get your finances in order and estimate how much you spend in a month. If your living expenses amount to $2,500, multiply this by three months, and your minimum savings goal will be $7,500. If you multiply it by 6 months, your maximum savings goal will be $15,000. To make the process less daunting, you can set a goal of saving at least $5,000 every 2 years. By the time you reach your third and fourth year of saving, you should hit your $7,500 goal.
You must reinforce your saving habit, otherwise your funds will not grow as planned. Make sure to allot a minimum savings amount per month. For this example, let’s calculate how much you should save per week to make $5,000 emergency savings in 2 years. That would make it $53 a week, which is $212 per month. This amounts to $2,544 in a year. Committing to this habit will save you $5,088 in 2 years.
Place your money in a high-interest savings account, which is different from a bank account that you regularly use. This way, you’re not tempted to use your reserve funds. Banks offer high-yield savings accounts that earn interest the longer your money sits in them. It also earns higher interest with more deposits. High-yield savings accounts are also easily accessible. This helps you get money in case an emergency happens any time.
A good way to ensure consistent savings is by automating money transfers. Certain banks offer to move money automatically between checking accounts and savings accounts. You can time automatic transfers when you get your pay check by using a direct-deposit arrangement. This way, you can set aside a specific amount every pay day. You don’t need to worry whether you still have enough for savings. This strategy helps move money directly to your emergency funds before you even touch it.
Another way to increase your emergency funds is by saving your tax refund. The Consumer Financial Protection Bureau (CFPB) states that tax refunds are one of the biggest checks workers receive each year. Consider contributing a portion of it to your emergency savings account. According to Washington Post, the average tax refund was around $3,100 in March 2020. This is a considerable sum that will surely boost your emergency savings.
Make sure to routinely check how much you’ve saved. If you think you can afford to make extra savings, adjust your contributions. This will help grow your savings faster.
For example, to save $5,000 emergency funds within 2 years, start with a weekly savings plan of $53 a week. This is $212 a month, which is $2,544 a year. You’ll save $5,044 in 2 years.
Now, let’s increase your weekly savings for the following year. If you can save $75 a week, that’s $300 a month, which amounts to $3,600 a year. After 2 years, you’ll be able to save $6,144. By adding extra to your weekly savings, you’ll exceed your $5,000 savings goal. If you keep up your savings for another year, that adds another $3,600 to your funds, which amounts to $9,744 in savings.
The figures above have not yet factored compounding interest if you deposit in a high-yield savings accounts. It also does not include added money from your tax refund. Nonetheless, making this much savings is only possible if you do not touch your funds. If ever you run into an emergency by the second year, you would at least have $6,144 to cover unexpected expenses. Starting from this amount can provide you with a little financial safety net.
If you have high-interest credit card debt, prioritize paying it down first. Reducing your credit card balance lowers interest charges, which means more of your income can go toward emergency savings. This frees up your cash flow, giving you more money to save for more important investments.
Once you’ve reached a reasonable savings goal, you may leave your emergency funds in peace or continue to contribute an amount. If you’re saving up for a car or house, you can open another savings account for that goal. But even if you’re not planning for major purchases, you can open a separate savings account specifically for irregular spending. This account is called your sinking fund.
Expenses covered by sinking funds include annual maintenance costs you need to anticipate. For example, if your laptop is due for timely repairs, you can use your sinking funds instead of your emergency savings. You can also use it to anticipate car repairs and home repairs. If you have a lot of room in your budget, sinking funds may even cover costs for gifts on friends’ birthdays.
You can learn more about sinking funds by reading our guide on our irregular payments calculator.
Kids take after their parents’ budgeting skills. When they see how well their mom and dad runs the household, it makes an impact on them. Show the importance of maximizing money for your needs. This way, they will understand that living within your means is possible, while being able to afford your wants.
Budgeting can be summarized into two main methods. This involves reducing your expenses and boosting your income. When it comes to reducing monthly costs, you have to create a list for important purchases and basic needs, and separate them from non-essential expenses.
As a rule, you should always prioritize your essential purchases over discretionary costs. But sometimes, it can be hard to draw the line. Which is why you need a proper guide, such as the 50-30-20 budget rule.
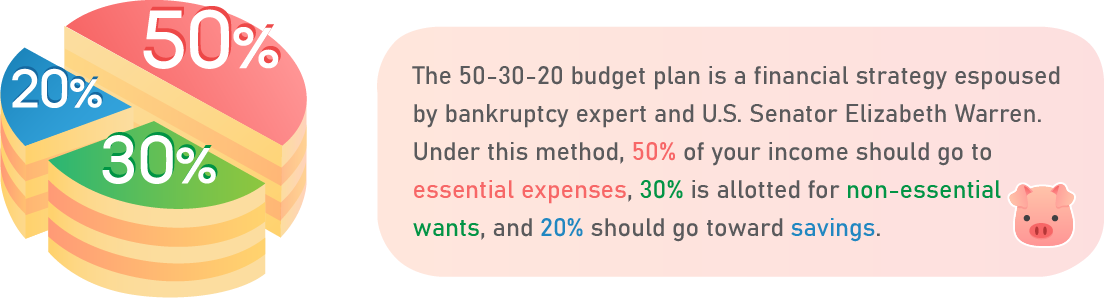
The 50-30-20 budget plan is a financial strategy espoused by bankruptcy expert and U.S. Senator Elizabeth Warren. Under this method, 50 percent of your income should go to essential expenses. Meanwhile, 30 percent is allotted for non-essential wants, and 20 percent should go toward savings. Warren wrote about the 50-30-20 budget method in her book entitled “All Your Worth: The Ultimate Lifetime Money Plan,” which helps people increase their savings and break free from debt.
The 50 percent refers to half of your after-tax income. This is the ideal way to allocate money for living expenses like food, transportation, mortgage, and utilities. But sometimes, you may need to spend more on basic necessities. Let’s say you have a toddler in the family. If you have a full-time job, you’re likely spending extra for childcare if you don’t have relatives looking after your child. When this happens, you should reallocate budget from your Non-essential Category. It also helps to reduce certain costs. For example, you can take public transport now and then, or carpool instead of driving.
Non-essential expenses are optional products and services that are good to have. Things like dining out, buying stylish shoes, or collecting vintage toys make life more worthwhile and enjoyable. In 2019, USA Today reported that the average American spends close to $18,000 a year on non-essential expenses, which is around $1,497 a month. The report also states the top three average non-essential expenses a month:
You can save more by preparing food at home and avoiding frequent takeout and restaurant meals. At the end of the day, it’s up to you which non-essential cost you’re willing to forego. Just make sure you’re not splurging too much on unnecessary purchases. It’s important to know when to cut back.
Finally, 20 percent of your after-tax income should go to savings. While it’s a good idea to start small, you should work your way up to save at least 20 percent of your salary. This includes money for emergency savings as well as your retirement fund. To become financially independent, a person needs 25 times their annual expenses. Setting aside less than 20 percent of your income will take too long for your money to grow. It will also not generate enough interest for a substantial amount. Keep this in mind especially when you’re saving long-term for your retirement.
The CFPB states that children use three fundamental building blocks for developing money management skills. These three functions are important for kids to acquire as they grow:
1
Executive Function – Includes the ability to plan early and remember information. Developing this skills helps them multitask, solve problems, and learn how to control their impulse. Kids learn these skills as early as three years old, and should be reinforced throughout their growth. 2
Financial Habits and Values – Involves learning rules that help kids figure out daily financial activities. It’s when kids observe financial practices and standards that they can emulate, such as saving and budgeting. 3
Financial Decision-Making Skills – Kids can apply sound financial decisions when they learn more about financial concepts. Along the way, they develop the skills and competencies needed to compare and analyze financial choices.
Parents can use these these building blocks to teach age-appropriate money management skills to kids. Below are some examples of how these functions can be taught:
For young kids in preschool, the CFPB recommends reinforcing planning ahead. Parents can start telling kids to save money for emergencies. An example is stocking extra food ahead of a bad weather. Show kids that setting aside money can go to buying extra food before blizzards or storms. This teaches them the value of preparation.
As for school-age children, parents should emphasize connecting values to spending habits. For example, mention how you always save loose change in a piggy bank. Or say you never purchase anything beyond what you can afford. When they see you practice these good examples, kids are likely to emulate them too.
For teenagers, you can talk about financial concepts in more detail. When you open the topic of buying a car, you can look up car prices and rates together online. Start explaining how interest rates increase car payments. One way to do this is by using a car payment calculator to compare how prices and rates impact savings. It’s also an interactive way to answer basic financial questions.
Below are lesson plans based on various parenting and financial sources that you can use to teach kids about financial literacy.
Kids between 3 to 5 years old are typically too young to grasp abstract financial concepts. However, this is the ripe age to start building a foundation that solidifies their ability to organize resources. It's the right time to teach the concept of money and basic problem solving skills. Kids should also learn how to delay gratification and help discipline their impulsive urges.
Between the age of 6 to 8 years old, kids should be exposed to more counting and basic arithmetic. It's the time they become more familiar with adding and subtracting objects. As they grow up, this basic skill will be their foundation for solving more complex math problems.
The following financial resources are appropriate for kids in preschool to 2nd grade:
By the time kids are 9 to 12 years old, they have a basic understanding of what money is and how it's used. Schools introduce them to more complex math problems involving money calculations. It's the right stage to teach them essential rules about managing and budgeting money. This is the appropriate time to start cultivating good financial habits and values which they can apply to the real world. And once they're in middle school (6th to 8th grade), they're more receptive to abstract financial concepts.
Around this time, kids are introduced to calculators and learn more about math concepts in school. There are different calculators, such as for measuring health markers, calculating time, as well as estimating personal finances. For a complete resource on calculators, visit our Complete History of Calculators for Kids page. It also has links to fun calculator games that help children sharpen their math skills.
Moreover, parents should encourage kids to watch more educational programs that impart financial literacy skills. An animated series called The Secret Millionaires Club has 26 online episodes. It features Warren Buffet as mentor to a group of adventurous kids who are entrepreneurs. Every episode shows how to make good financial decisions and solves basic lessons on putting up a business. It's a great way to reinforce money management, which also helps kids get interested in building income.
Once kids hit their teens between 13 to 18 years old, they like to explore and be more independent. This is the time when they start to get part-time jobs and experience earning money. They are also faced with more financial decisions such as choosing the right cellphone plan, buying a laptop, and managing their ‘social budget' (food, clothes, video games, watching movies, going to events, etc.).
Giving sound advice help teens gain confidence in making financial decisions. It's also a good time to encourage opening their own savings account to save a portion of their earnings. Make your teen feel comfortable about asking financial questions, whether it's about mortgage payments, handling credit card debt, or student loans for college. Open communication about financial concerns can also help strengthen your relationship.
The following are financial education resources appropriate for teens between 9th to 12th grade:
While we put together a collection of our favorite curriculum in the above sections, many sites offer searchable databases which can help teach students important lessons which tie in with recent news themes. The following websites offer great financial plans for school children.
Once your kids grow up with their finances in order, it’s easier to prepare for major life purchases. Ideally, people should save in advance to pay for college education, buy a car, and own their first home. Aside from preparing enough savings, you have to make informed financial decisions before settling for just any loan deal. Before your kids go into the real world, you must teach them how to differentiate between a good or bad loan.
The kind of debt you acquire, together with its quantity, length, and cost, can determine whether it’s a good or bad debt. In general, any loan with high interest that drags for years is considered a bad debt. This can happen with a buy here, pay here car loan, credit cards that roll over month to month for many years, or a high-interest private student loan.
For example, with student debt, some large post-graduate loans can run as long as 30 years (can apply if you do not qualify for public student loan forgiveness). For cars, if you end up with an upside-down deal, you’ll pay more for a vehicle with significantly less value.
Teach your child the concept of credit scores before they rack up debt. In a Parents.com feature, Sascha Zuger’s 6-year-old son Nakoa took time to save for an expensive train set. But after months of saving, he was disappointed to find the train set was unavailable. Wishing there was a way to buy things and pay for them later, Sascha explained how credit cards worked to Nakoa.
By this time, Nakoa had been an eager saver, so Sascha improvised a credit rating system. If Nakoa maintained a score of 4, she would extend him credit if he liked a toy he couldn’t afford. But if his score was lower than 4, his mom didn’t lend him money. This taught Nakoa that his spending habits impacted his ability to borrow money.
In making major financial decisions, here’s some helpful advice you can use to manage your finances. Likewise, these are tips you can impart to your kids when they’re older and more aware of their financial options.
In a 2018 Sallie Mae report, 90 percent of parents believe college education is a good investment for their child’s future. In the same study, over 8 out 10 said they were willing to stretch their finances to give their child the best opportunities.
Moreover, getting a college degree boosts your income. The National Association of Colleges and Employers (NACE) estimates that the average annual starting salary of college graduates in 2018 was around $50,005. Meanwhile, the average annual salary of a person with a high school diploma was around $35,256 in 2018. That’s a difference of $14,749 a year.
Parents are encouraged to save early for their child’s college expenses by taking a 529 education savings plan. These are qualified tuition plans sponsored in most states in the country. 529 education plans allow you to open an investment account that covers your child’s college tuition, mandatory fees, as well as room and boarding costs. They can also be used in any college or university.
In the past, beneficiaries were only allowed 529 education plans when they reached 9 years old. But in recent years, there are no age restrictions for beneficiaries. As long as you provide your child’s name and Social Security Number or individual Taxpayer Identification Number, you can apply for a 529 education plan. You can withdraw tax-free from this account whenever you use it for your child’s qualified education needs. Parents are entitled to withdraw up to $10,000 a year for primary and secondary school tuition.
On the other hand, other families may not afford to pay for their child’s college tuition. When this happens, they have the option to take student loans. Student loans typically have low interest rates, specifically if you take a federal student loan. The general timeline for paying a student loan takes at least 10 years. This also depends on the size of the debt, with some taking as long as 20 years.
The graph below shows the average time it takes for people to repay their student loans in 2018. It’s classified according to the size of the loan balance.
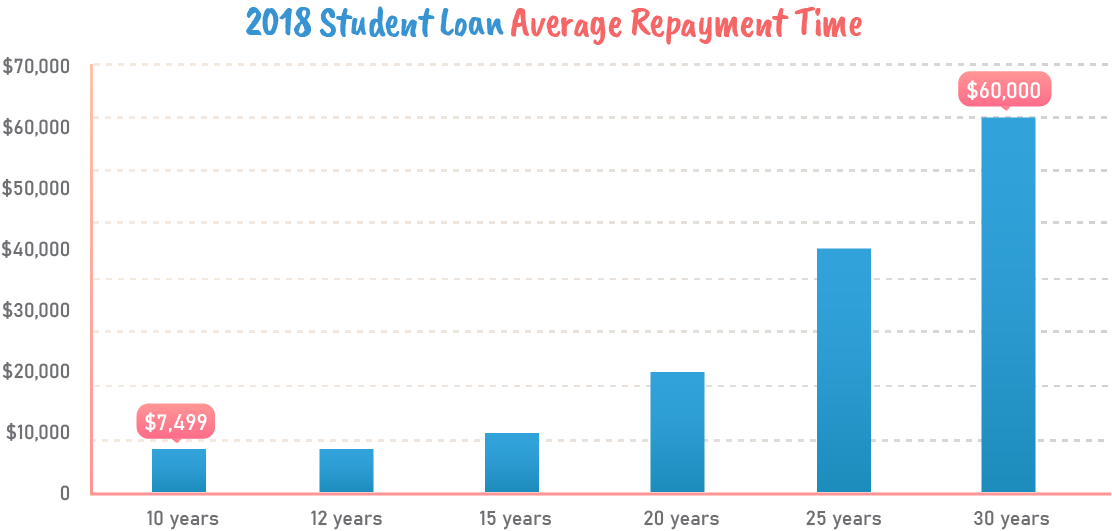
2018 Student Loans Average Repayment Time
| Average repayment time | Student loan balance |
|---|---|
| 10 years | $7,499 |
| 12 years | $7,500 – $9,999 |
| 15 years | $10,000 – $19,000 |
| 20 years | $20,000 – $39,999 |
| 25 years | $40,000 – $59,999 |
| 30 years | $60,000 and up |
Data from the U.S. Depart of Education
Student loan balances at $7,499 take an average of 10 years to pay back. This is the least amount of time required by student loan programs. Higher student loan balances take much longer to pay. Balances between $10,000 to $19,999 can take an average of 15 years to repay. Meanwhile, student loans at $60,000 and above take an average of 30 years to pay back. That’s just as long as most residential mortgages.
Since larger debt takes longer to pay back, avoid borrowing too much money for college. People who incur large student debt are more pressured to look for higher paying positions to pay off their loan.

In recent years, reports show that teens are no longer rushing to get their driver’s license like they did in the past. Back then, driving a car at 16 was considered a status symbol of freedom. But a 2019 WSJ article shows that more young people are delaying their driver’s license. They are also choosing to buy a car much later. In WSJ’s interview section, David Metzler comments on how his 16-year-old daughter June sees no urgency in getting a driver’s license.
"I went out and got it immediately… I wanted to get out of the house and go places. For her, getting a license is more like planning for the future."
David Metzler
Today, kids are growing up in the age of ride-hailing apps such as Lyft and Uber. Teens like June are also content with hanging out after school or inviting friends at home. Once they reach their 20s, young adults typically move to large cities with mass transportation. This further removes buying a car in their priorities. Though many teens drive today, their percentage has evidently decreased in the last three decades.
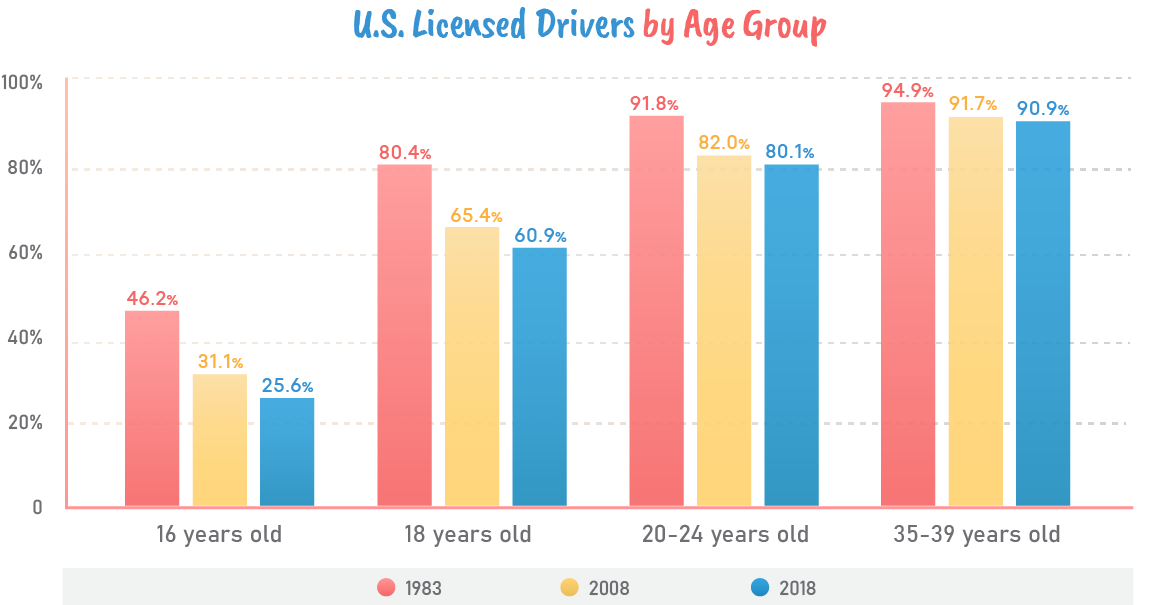
U.S. Licensed Drivers from Different Age Groups
| Year | Age 16 | Age 18 | Ages 20-24 | Ages 35-39 |
|---|---|---|---|---|
| 1983 | 46.2% | 80.4% | 91.8% | 94.9% |
| 2008 | 31.1% | 65.4% | 82% | 91.7% |
| 2018 | 25.6% | 60.9% | 80.1% | 90.9% |
Data from Statista
Based on the data above, in 1983, approximately 46.3 percent of 16-year-olds had a driver’s license in America. In 2008, this decreased to 31.1 percent, and by 2018, the percentage dwindled to 25.6 percent. That’s a 20.6 percent difference from 1983.
Likewise, there were more 18-year-old drivers in 1983 at 80.4 percent. In 2008, this decreased to 65.4 percent, and by 2018, it went down to 60.9 percent. Young people seem to prefer getting their driver’s license between the age of 20 to 24, where 80.1 percent got their license in 2018. Though there’s a decreasing trend for young license holders, the percentage of adult drivers between 35 to 39 years did not decrease considerably.
Why do young people prefer to drive late? The major reason is because of rising vehicle prices. In April 2020, Edmunds reports that the average transaction price for a cheap new car is around $37,000, which is a big leap from previous years. According to WSJ, the average price of a new car in 2018 was $32,544. That’s an increase of around $7,000 from $25,490 in 2008.
In 2018, the average monthly payment for a new car was 10 percent of the median household income. This is an expensive cost most American families cannot afford to prioritize. Moreover, getting a driver’s license is becoming more expensive for teens. Because of state budget cuts, many public schools can no longer provide free driving lessons for students. Private driving lessons, on the other hand, usually cost over a $1,000. And when people choose to get their driver’s license late, they also buy a car much later in life.
With higher car prices, most young buyers in Generation Z are more likely to purchase used compact vehicles over SUVs. Next is a midsize car, followed by a compact SUV. Since this generation grew up during a financial crisis, and even witnessed the impact of the Covid-19 pandemic, young people tend to grow up more budget-conscious than their parents.
Below is a chart that shows the share of used vehicle sales purchased by Generation Z consumers in 2018.
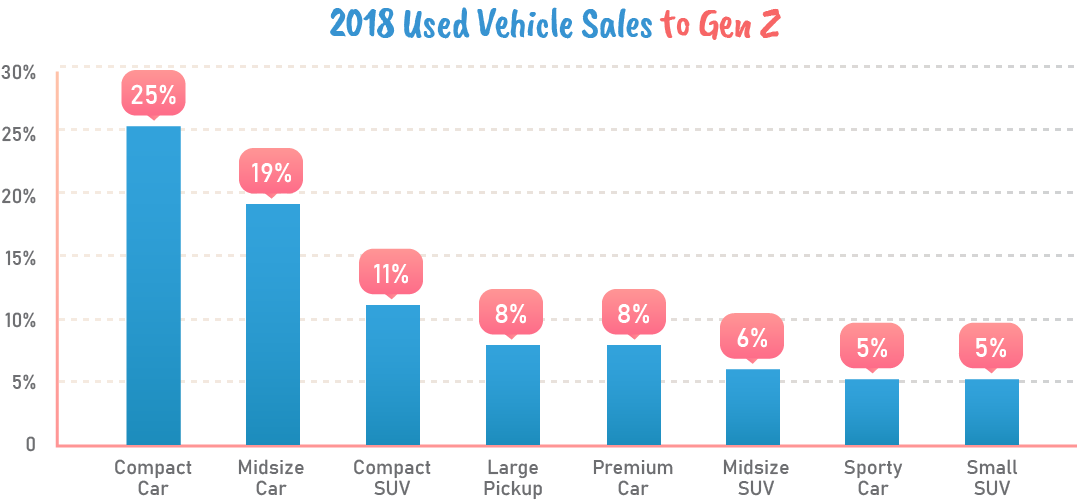
2018 Used Vehicle Sales to Generation Z Consumers
| Vehicle Type | % bought by Gen Z |
|---|---|
| Compact car | 25% |
| Midsize car | 19% |
| Compact SUV | 11% |
| Large pickup | 8% |
| Premium car | 8% |
| Midsize SUV | 6% |
| Sporty car | 5% |
| Small SUV | 5% |
Data from The Wall Street Journal
Keep car loan payments within 20% of your monthly take-home salary. Give this advice to your child before they jump into any car deal in the future. Amounts beyond the 20% range make it difficult for anyone, especially first-time car buyers, to keep up with payments and living expenses.
Ideally, a buyer should also provide a 20% down payment to reduce the car loan’s principal. A lower principal helps reduce interest costs. Next, tell them to keep the car’s loan term within 5 years. A longer loan means they will end up paying higher interest charges. Since cars depreciate fast, people shouldn’t pay more when it has significantly less value.
Our Pigly car calculators provide parents with detailed guides on buying and maximizing auto purchases:

Taking out a mortgage is one of the biggest financial decisions people make in their lives. It’s sign of financial stability and commitment to a long-term payment plan. The large expense is reason enough to get your finances in order. And by teaching kids early money management, you are preparing them to deal with this major life purchase in the future.
Just how expensive are houses? The cost of a home has drastically increased since the 1960s. Back in Q1 of 1963, the median sales price of a house in the U.S. was $17,800, based on data from the Federal Reserve Bank. In another report by Business Insider, using data from Zillow, the median price of a house in the 1960s was at $11,900. This is around $96,681 in 2019 when adjusted for inflation.
By Q1 of 2020, the median sales price of a house grew to $329,000. This is 18 times more expensive than median house prices in the ’60s. And if we compare Q1 of 2020 with Q1 of 2010, the median house price was $222,900 a decade ago. This means that median home prices increased by $106,100. So unless property values continue to decline in the next 10 years, future homebuyers must factor the rising cost to prepare for a mortgage.
Below is a graph showing how median home sale prices have changed in the U.S. between 1963 to 2020.
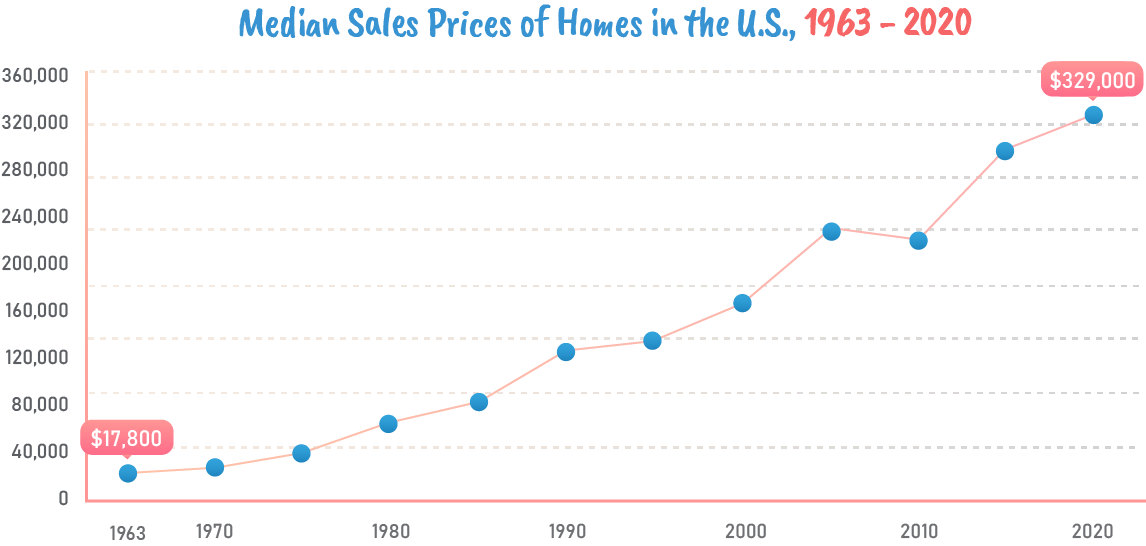
Median Sales Prices of Homes in the U.S., 1963-2020
| Year | Q1 Median Sales Price | Year | Q1 Median Sales Price |
|---|---|---|---|
| 1963 | $17,800 | 1992 | $119,500 |
| 1964 | $18,900 | 1993 | $125,000 |
| 1965 | $20,200 | 1994 | $130,000 |
| 1966 | $21,000 | 1995 | $130,000 |
| 1967 | $22,300 | 1996 | $137,000 |
| 1968 | $23,900 | 1997 | $145,000 |
| 1969 | $25,700 | 1998 | $152,200 |
| 1970 | $23,900 | 1999 | $157,400 |
| 1971 | $24,300 | 2000 | $165,300 |
| 1972 | $26,200 | 2001 | $169,800 |
| 1973 | $30,200 | 2002 | $188,700 |
| 1974 | $35,200 | 2003 | $186,000 |
| 1975 | $38,100 | 2004 | $212,700 |
| 1976 | $42,800 | 2005 | $232,500 |
| 1977 | $46,300 | 2006 | $246,300 |
| 1978 | $53,000 | 2007 | $257,400 |
| 1979 | $60,600 | 2008 | $233,900 |
| 1980 | $63,700 | 2009 | $208,400 |
| 1981 | $66,800 | 2010 | $222,900 |
| 1982 | $66,400 | 2011 | $226,900 |
| 1983 | $73,300 | 2012 | $238,400 |
| 1984 | $78,200 | 2013 | $258,400 |
| 1985 | $82,800 | 2014 | $275,200 |
| 1986 | $88,000 | 2015 | $289,200 |
| 1987 | $97,900 | 2016 | $299,800 |
| 1988 | $110,000 | 2017 | $313,100 |
| 1989 | $118,000 | 2018 | $331,800 |
| 1990 | $123,900 | 2019 | $313,000 |
| 1991 | $120,000 | 2020 | $329,000 |
Data from the Federal Reserve Bank of St. Louis
Location is an influential factor in housing prices. If you want a house near your workplace, grocery stores, and shopping malls, it’s usually more expensive. And for those looking for luxury homes, houses with scenic views overlooking lakes can easily cost a fortune.
Home prices vary per state, with houses in major cities and coastal areas costing more than those in less crowded suburbs. Business Insider reports that coastal states such as California and Massachusetts make up majority of the most expensive locations to purchase a house. On the other hand, Midwestern states like Mississippi, Ohio, and Iowa are some of the most affordable places to buy a home. For instance, in 2019, the median listing price for a house in West Virginia was $166,48, while the median listing price for a home in Massachusetts was more costly at $479,900.
Mortgage debt is generally regarded as one of the safest forms of good debt. This is because your monthly payments go toward building equity in your home. But as evidenced by the Great Depression (1929-1939) and subprime mortgage crisis (2007-2010), prices don’t always rise indefinitely. If you borrow more than you can afford, it is a huge risk. You can lose your home to foreclosure if you default on your loan. Plus, if house prices drop, you might pay a lot more for a home with significantly lower value. You can try to sell the house. But since the price has dropped, it may not cover your entire mortgage. So as a rule, it’s best to only borrow what you can afford.
The graph below shows how the median age for American homebuyers has changed from 1981 to 2019.
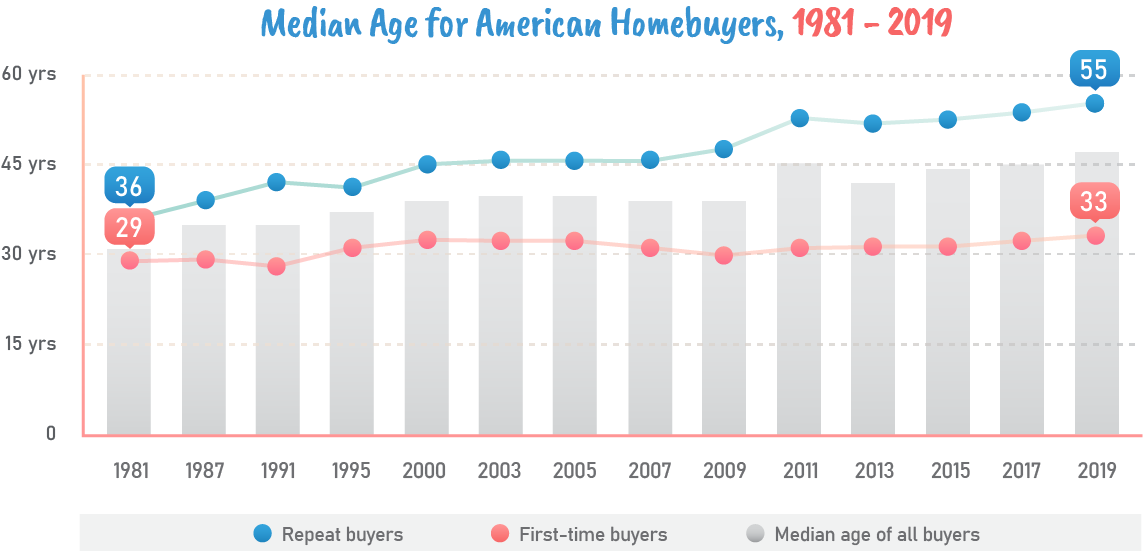
| Year | Median age, all buyers | First-time buyers | Repeat buyers |
|---|---|---|---|
| 1981 | 31 | 29 | 36 |
| 1985 | 33 | 29 | 37 |
| 1987 | 35 | 29 | 38 |
| 1989 | 34 | 30 | 40 |
| 1991 | 35 | 28 | 42 |
| 1993 | 42 | 32 | 44 |
| 1995 | 37 | 31 | 41 |
| 1997 | 35 | 32 | 39 |
| 2000 | 39 | 32 | 45 |
| 2002 | 36 | 31 | 41 |
| 2003 | 40 | 32 | 46 |
| 2004 | 39 | 32 | 45 |
| 2005 | 40 | 32 | 46 |
| 2006 | 41 | 32 | 47 |
| 2007 | 39 | 31 | 46 |
| 2008 | 39 | 30 | 47 |
| 2009 | 39 | 30 | 48 |
| 2010 | 39 | 30 | 49 |
| 2011 | 45 | 31 | 53 |
| 2012 | 42 | 31 | 51 |
| 2013 | 42 | 31 | 52 |
| 2014 | 44 | 31 | 53 |
| 2015 | 44 | 31 | 53 |
| 2016 | 44 | 32 | 52 |
| 2017 | 45 | 32 | 54 |
| 2018 | 46 | 32 | 55 |
| 2019 | 47 | 33 | 55 |
Data from Bloomberg. No data for 1983 and 1999. The survey was done every other year prior to 2002.
Where you live will automatically affect your expenses. Likewise, to decrease your housing costs, you can actively look for homes in low-cost locations. It can be a challenge to find an affordable home in the right place, but taking the time to compare prices from at least three listings can be well worth it.
Another way to save is to look for a reasonably sized home with energy-efficient features. Choosing an energy-efficient house will help you save on electricity bills. This is one of the reasons why tiny homes became popular in recent years. Smaller homes usually use less power and are environmentally friendly, with lower energy costs.
Ideally, mortgage payments must not exceed over 28% of your monthly salary. Paying beyond 28% will make it more challenging to budget living expenses and other debts. This puts you at higher risk of default. It also helps to save a 20% down payment before purchasing a house. This reduces your principal balance and gets rid of private mortgage insurance (PMI), which is required if you make a lower down payment.
Expensive monthly payments are a struggle for many consumers, so most homebuyers usually opt for a 30-year fixed mortgage. Longer mortgages have lower monthly payments than 15-year mortgages. But you can shorten your term later on by refinancing your mortgage and getting lower rate. Refinancing is taking out a new loan to replace your current one. If you cannot refinance, you can make extra payments to pay down your mortgage early. Remember: the shorter your loan, the less you’ll spend on interest charges.
For more practical advice on buying a home and managing housing costs, visit these guides on our calculators:
Apart from getting ready for emergencies and major purchases, saving ultimately prepares you for retirement. It is the key to achieving a comfortable life when you’re no longer working. Once you’re financially secure, your kids also don’t have to worry too much about your needs. They can focus on building their lives without having to financially support you throughout retirement.
In 2019, Forbes reported that close to 25 percent of all American adults have no retirement savings or pension at all. This is based on data from the U.S. Federal Reserve in May 2019. For those near retirement age, around 17 percent of people aged 45 to 59 had no retirement savings. Meanwhile, 13 percent of adults aged 60 and above also lacked retirement funds. The report showed that only 42 percent of adults between 45 to 59 years old felt prepared for retirement, while only 35 percent of adults aged 30 to 44 felt they were prepared to retire.
The chart below illustrates the share of Americans with no retirement savings in 2019. It’s based on respondents between ages 18 and 60 years old and above.
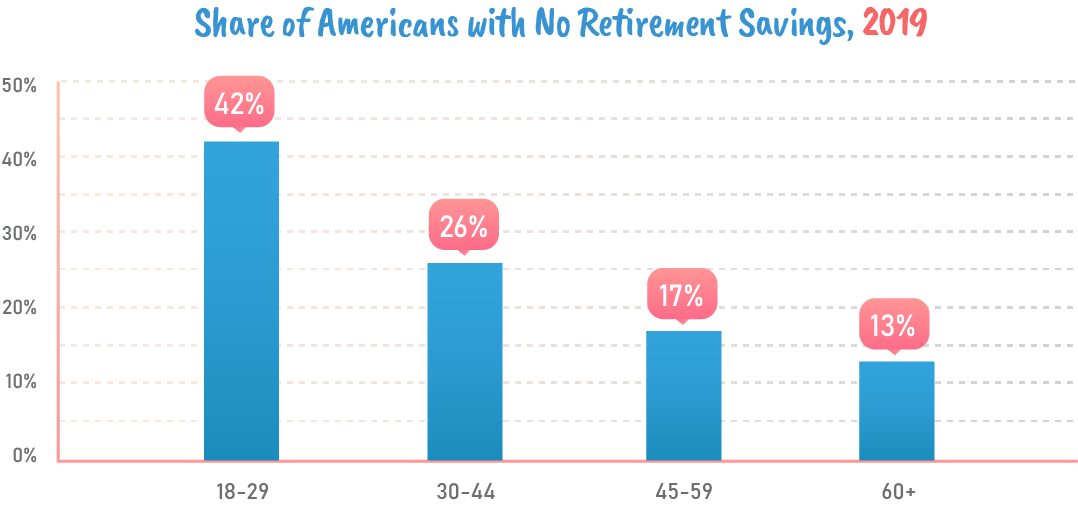
Share of Americans with No Retirement Savings, 2019
| Age group | Percentage |
|---|---|
| 18-29 | 42% |
| 30-44 | 26% |
| 45-59 | 17% |
| 60+ | 13% |
Data from the U.S. Federal Reserve
Lack of retirement savings is high among people at a young age. This is understandable, as young adults are still starting to save. Many of them are studying and looking for stable work to build savings. But if you teach your child to save early, they may have a little extra to start growing their emergency funds. Once they have emergency savings, they can start savings retirement funds earlier.
As people get older, they usually accumulate more income. By the age of 30 to 44, people should have a substantial amount of money set aside for retirement funds. Towards their 60s, people typically have more savings. However, it’s alarming to note that 13 percent of adults in retirement age still do not have savings in 2019.
Back then, more people aimed to achieve early retirement. But these days, more Americans are actually planning to work through retirement, even if some of them don’t need the money. Business Insider reported that a growing number of baby boomers and Gen Xers are not ready to stop working. Close to one-third of Americans over 40 said they would continue to work part time even after retiring. Among the respondents, Gen Xers, who are the most unprepared for retirement, were likely to say they would keep working to earn. Some adults are also expecting to fully retire by the age of 72.

There are different ways to set up retirement funds for your future. Retirement plans come with varied features. They also have limitations on the amount of money you can contribute annually. There may also be other restrictions that depend on your modified adjusted gross income.
The following are common types of retirement plans you can choose from:
Offered as an employee benefit, 401(k) plans are workplace retirement accounts that let you contribute a part of your pre-tax paycheck to tax-deferred investments. This lowers the amount of income you must pay taxes on within that year. For instance, if you earned $75,000 and contributed $5,000 to your 401(k) plan, you’d only be taxed for $70,000. Likewise, your investment gains are tax deferred until such time you withdraw money during retirement.
Contribution limits for 401(k) plans vary per year. In 2019, the Internal Revenue Service (IRS) set contribution limits at $19,000 and raised it to $19,500 in 2020. At the age of 50 and up, this grows to around $26,000. The low contribution limits can keep you from saving more.
Traditional 401(k) plans and IRAs require investors to begin taking withdrawals once they reach 70 1/2 years old.
Traditional IRAs are tax-favored investment accounts used for investing in bonds, mutual funds, stocks and exchange traded funds. This means you can purchase or sell investments using an IRA. You also don’t have to pay annual taxes on your investment gains. This allows your savings to grow faster. Moreover, you can deduct IRA contributions on your income tax if you do not have a 401(k) account. This also helps lower your taxable income for that year.
Consider taking an IRA if you’ve reached the limit on your 401(k) annual contributions, or if your company does not provide retirement plans.
Roth IRA contributions are comprised of after-tax dollars. The money generated in a Roth IRA account is never taxed again. Unlike 401(k) plans and traditional IRAs, you can withdraw from a Roth IRA before retirement age. However, you can only do so if 5 years has passed since your first contribution. Roth IRAs also do not require you to start withdrawing money once you reach a certain age.
Investors can contribute to both an IRA and Roth IRA as they please to maximize their savings. But take note: the total contributions for a year cannot be more than $6,000 as of 2020.
Fidelity states that as a rule of thumb, you should save at least 15 percent of your pre-tax income each year for retirement. This includes any contributions you may receive from your employer. The research is based on an assumed retirement age of 67, where you ideally start saving 15% of your pre-tax income starting at the age of 25. This can potentially support a replacement annual income rate equivalent to 45% of your pre-retirement annual income, presuming you do not have pension.
But take note: The 45 percent income replacement target is based on retirement savings for people with a salary between $50,000 to $300,000. It also does not include Social Security or pension income. Thus, if your annual income does not fall within this range, the savings rate does not apply. You may still need to save more than 15% of your pre-tax income, depending on your lifestyle, desired retirement age, assets saved, and other factors.
The Federal Reserve 2019 report states that the median retirement savings is $60,000 for all adults. By retirement age, this figure should grow to a median of $228,900. It’s a small sum after 20 years, which means you definitely need to save more.
On average, the medical costs for senior couples during retirement is projected to be in the $200,000 range. Unless you save more, majority of your retirement funds are likely to go to healthcare expenses. This is also why it’s better to start saving early. If you let the magic of compound interest grow your savings, you’ll certainly have more funds for retirement.
To estimate how much retirement savings you need for your target age, you can use our retirement calculator.
Need more information on building retirement funds? The following are calculators with guides on our site that can help manage your retirement savings:
As early as now, it’s better to explain certain financial concepts to prepare kids for the future. Though saving and budgeting are concepts taught in school, it’s the parents task to guide them in making informed financial decisions.
As your child grows, they must deal with many financial choices in life. Debts can easily spiral out of control, especially if they’re faced with large emergency expenses. For this reason, the best way to protect your kids is to encourage saving emergency funds. There’s no better time to start saving than now.
Once your kid picks up good financial habits, they will be better equipped for major financial decisions as adults. This is a crucial skill that will help them recover from financial challenges, helping them build the life they want.
Jose Abuyuan is a web content writer, fictionist, and digital artist hailing from Las Piñas City. He is a graduate of Communication and Media Studies at San Beda College Alabang, who took his internship in the weekly news magazine the Philippines Graphic. He has authored works professionally for over a decade.