 Pigs Helped President Trump Win the Trade War
Guide published by Jose Abuyuan on February 11, 2020
The United States and China — the world's two leading economies — have been in a heated trade war, especially in the last two years. U.S. President Donald Trump has long indicted China for unjust trading practices and stealing intellectual property. But with China rising as a global economic power, America is perceived to slow it down.
Trade wars ensue when a country enforces steep tariffs on imported goods. To strike back, a foreign country responds by imposing analogous trade protection laws toward the other country. As this escalates, their dispute negatively impacts international trade.
Both countries have imposed stringent tariffs on each other's goods. But with China's severe pork shortage, they are obliged to relax tariffs on imported meat, even from America.
In this feature, we'll review the history of the trade war, as well as an in-depth look at China's massive pork market and how it impacts the global trade economy. Then, we'll analyze China's pork crisis and how it inevitably gave America the upper hand in the trade war.
The Bretton Woods system was established in 1944 during a conference of all World War II Allied nations. It's aim was to rebuild the international economic system, where countries were mandated to maintain external exchange rates within 1 percent by using gold to back their currency. In the agreement, the dollar became the main reserve, with all currencies being backed by gold.
Prior to the Bretton Woods system, most nations adhered to the gold standard. This entailed every country would redeem its currency for its value in gold.
In 1960, economist Robert Triffin testified before the U.S. congress to expose a fundamental problem in the international monetary system. In particular, with the U.S. dollar being the global reserve currency. IMF.org documents these concerns:
“If the United States stopped running balance of payments deficits, the international community would lose its largest source of additions to reserves. The resulting shortage of liquidity could pull the world economy into a contractionary spiral, leading to instability.”
“If U.S. deficits continued, a steady stream of dollars would continue to fuel world economic growth. However, excessive U.S. deficits (dollar glut) would erode confidence in the value of the U.S. dollar. Without confidence in the dollar, it would no longer be accepted as the world's reserve currency. The fixed exchange rate system could break down, leading to instability.”
The capacity to print dollars to buy foreign goods and services is referred to as exorbitant privilege. According to the Management Study Guide, if the U.S. needs to deal with account deficits, it gave them tremendous advantages compared to other countries, such as the following:
1
The U.S. can keep on buying whatever it wants. And when the time comes to pay proceeds, they can print more dollars for payments. But when the government does this, they take value from everyone that holds the U.S. dollar. Other countries do not have this privilege; they cannot simply print more money to settle their account deficits.
2
The money used to pay debts goes back to the U.S. central bank. As for other countries, when they settle their debts, the money they spend returns to the Federal Reserve.
3
People invest in U.S. treasury bonds, which is the safest dollar denominated asset. When many people invest in treasury bonds, its yields decrease. Because of this, the U.S. government can borrow money at a much lower cost from the world. They take full advantage of this privilege, borrowing over $2 billion a day.
In February 1965, French president Charles de Gaulle cautioned against over-dependence on the U.S. dollar in international trade.
By then, two major factors harmed the balance of U.S. payments: the Vietnam war and the “Great Society” welfare programs. The Great Society programs were ambitious initiatives led by U.S. Democratic President Lyndon B. Johnson (1964-65) to end poverty and reduce crimes. Meanwhile, France was converting their trade surplus from the U.S. into gold.
In August 15, 1971, U.S. President Richard Nixon officially terminated the dollar convertibility into gold. This paved the way for the current era of fiat currency.
The pricing of oil exports into dollars was made possible in a 1974 agreement between U.S. Secretary of State Henry Kissinger and Prince Fand Ibn Abdel Aziz, the Second Deputy Premier of Saudi Arabia.
The. U.S. dollar is the global reserve currency that is used in most international trade, including oil. The petrodollar system, which is the currency paid to oil-exporting nations, created additional demand for dollars in other countries. This need is justified to hold in reserves and protect trade. Under the arrangement, oil profits are recycled back into financial assets.
According to an article by James Grant on the National Interest, petrodollar recycling is:
“[A] win-win for all involved: oil-rich states enjoy a safe place to store their petro-profits, and the United States gains a key source of financing for its deficit spending. With few exceptions, any country wishing to purchase oil must first obtain U.S. dollars, creating a significant demand for the currency in international markets. Thus, the petro-dollar also plays a critical role in generating global confidence in the dollar. And in currency markets, confidence is king.”
Countries that are dependent on a particular commodity, with thriving export markets, often suffer from Dutch disease. This condition is characterized by the existence of underdeveloped economic sectors despite a strong local currency due to exports. It also makes wages artificially expensive on international markets.
In his article in the Financial Times, Brendan Greeley argued that the U.S. dollar reserve currency status is driving Dutch disease in the United States. Greeley wrote:
“Most models of Dutch disease focus on exchange rates — demand for a country's primary commodity makes its currency relatively more valuable, depressing exports of manufactured goods. But Krugman (1987) suggests that once a country neglects its manufacturing sector, it may have a hard time rebuilding it.”
The elevated price of the U.S. dollar, centered on being the global reserve currency, leads to trade imbalances. To offset this, there must be investments which stabilizes financial flows.
Sir James Goldsmith, who represented the French constituency as a member of the European parliament, predicted many of our current economic problems. In his interview with journalist Charlie Rose, he discussed the implications of free-trade agreements shortly after the North American Free Trade Agreement (NAFTA) was approved, and before the General Agreement on Tariffs and Trade (GATT) was passed in 1994.
Over the decades, the U.S. developed a growing structural trade imbalance with China. This further accelerated when China was admitted into the World Trade Organization (WTO) in December 2001. The graph below is taken from the Asia Pacific Journal Japan Focus (APJJF), which shows trade balance between U.S. and China from 1972 to 1990.
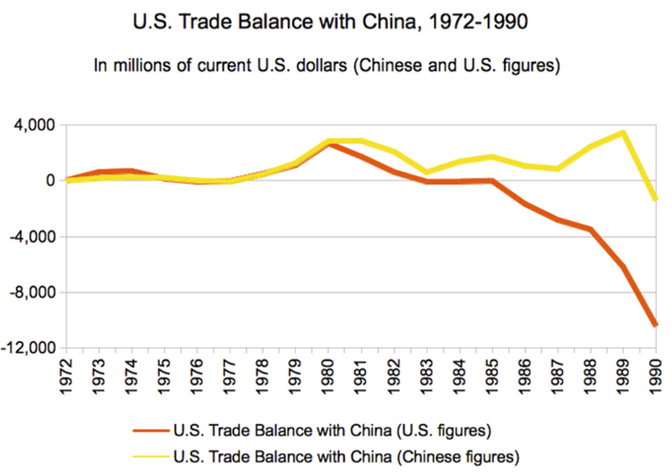
The graph illustrates slow but persistent growth of U.S. exports to China between 1975-1977. By 1980 onward, we see considerable discrepancies in trade statistics between the two countries. According to APJJF, the 1980s coincided with China's “opening to the outside world.” AAJJF notes that a great deficit occurred in 1986:
“American statistics show that 1986 was a turning point, with a US$1.67 billion trade deficit against the United States, which kicked off a deep, quarter-of-a century trade deficit with the People's Republic. In stark contrast, the Chinese figures for 1986 show a more than US$1 billion deficit against the P.R.C.—one point on the long curve of a trade deficit stretching from 1973 through 1992.”
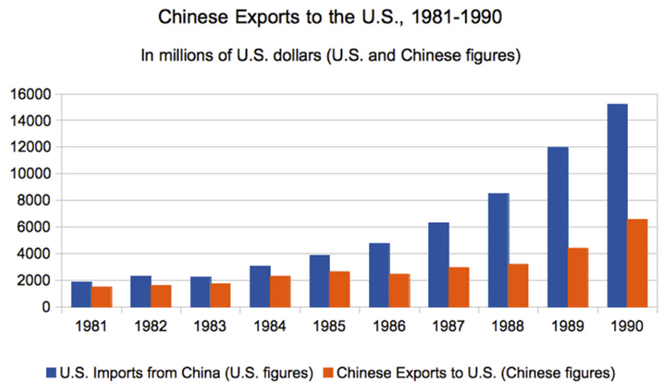
In the mid-1980s, a growing number of companies began engaging in direct export and import trade. The Chinese government loosened control and focused on revenue creation, turning China into a profitable export-processing zone. However, the U.S. continued to impose export restrictions on technology and equipment to China. At the same time, the U.S. bought more products from China than it sold to the country. AAJJF's graph below illustrates Chinese exports to the U.S. from 1981 to 1990.
At the start of the 1990s, the total volume of the China-U.S. bilateral trade was below 3 percent of the overall U.S. world trade. China joined the WTO in 2001 which, paved a new era in export-driven U.S.-Chinese relations. In 2010, China became the world's second largest economy. By 2012, its bilateral trade volume rose to 14 percent or $3.86 trillion. This was the first time China surpassed the U.S. as the world's largest trading nation. Below is AAJJF's graph which highlights U.S. trade balance with China from 1990 to 2012.
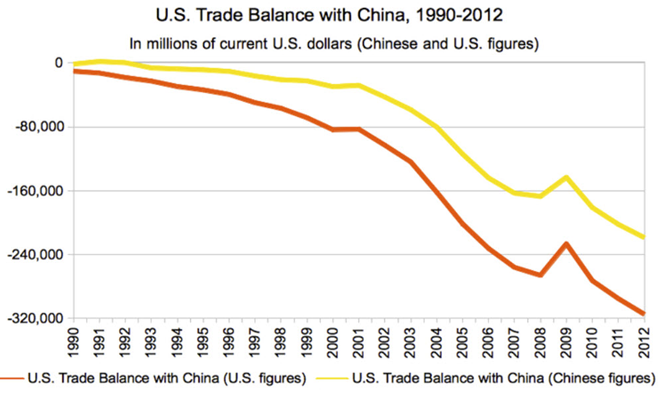
As of January 2013, APJJF notes that China owned $1.2 trillion in American debt out of an overall debt of $16 trillion. That was more than 100 percent of the U.S. GDP in 2012.
For a historical overview of the U.S. trade balance with China from 1985 to 2019, click to view the table and graph below. The data is from the U.S. Census Bureau.
Data of U.S. trade in goods with China (1985-2019) from the U.S. Census Bureau. All figures are in millions of U.S. dollars.
| Year | Exports | Imports | Balance |
|---|---|---|---|
| 1985 | 3,855.70 | 3,861.70 | -6 |
| 1986 | 3,106.30 | 4,771.00 | -1,664.70 |
| 1987 | 3,497.30 | 6,293.60 | -2,796.30 |
| 1988 | 5,021.60 | 8,510.90 | -3,489.30 |
| 1989 | 5,755.40 | 11,989.70 | -6,234.30 |
| 1990 | 4,806.40 | 15,237.40 | -10,431.00 |
| 1991 | 6,278.20 | 18,969.20 | -12,691.00 |
| 1992 | 7,418.50 | 25,727.50 | -18,309.00 |
| 1993 | 8,762.90 | 31,539.90 | -22,777.00 |
| 1994 | 9,281.70 | 38,786.80 | -29,505.10 |
| 1995 | 11,753.70 | 45,543.20 | -33,789.50 |
| 1996 | 11,992.60 | 51,512.80 | -39,520.20 |
| 1997 | 12,862.20 | 62,557.70 | -49,695.50 |
| 1998 | 14,241.20 | 71,168.60 | -56,927.40 |
| 1999 | 13,111.10 | 81,788.20 | -68,677.10 |
| 2000 | 16,185.20 | 100,018.20 | -83,833.00 |
| 2001 | 19,182.30 | 102,278.40 | -83,096.10 |
| 2002 | 22,127.70 | 125,192.60 | -103,064.90 |
| 2003 | 28,367.90 | 152,436.10 | -124,068.20 |
| 2004 | 34,427.80 | 196,682.00 | -162,254.30 |
| 2005 | 41,192.00 | 243,470.10 | -202,278.10 |
| 2006 | 53,673.00 | 287,774.40 | -234,101.30 |
| 2007 | 62,936.90 | 321,442.90 | -258,506.00 |
| 2008 | 69,732.80 | 337,772.60 | -268,039.80 |
| 2009 | 69,496.70 | 296,373.90 | -226,877.20 |
| 2010 | 91,911.10 | 364,952.60 | -273,041.60 |
| 2011 | 104,121.50 | 399,371.20 | -295,249.70 |
| 2012 | 110,516.60 | 425,619.10 | -315,102.50 |
| 2013 | 121,746.20 | 440,430.00 | -318,683.80 |
| 2014 | 123,657.20 | 468,474.90 | -344,817.70 |
| 2015 | 115,873.40 | 483,201.70 | -367,328.30 |
| 2016 | 115,594.80 | 462,420.00 | -346,825.20 |
| 2017 | 129,797.60 | 505,220.20 | -375,422.60 |
| 2018 | 120,148.10 | 539,675.60 | -419,527.40 |
| 2019 | 97,751.70 | 418,575.00 | -320,823.40 |
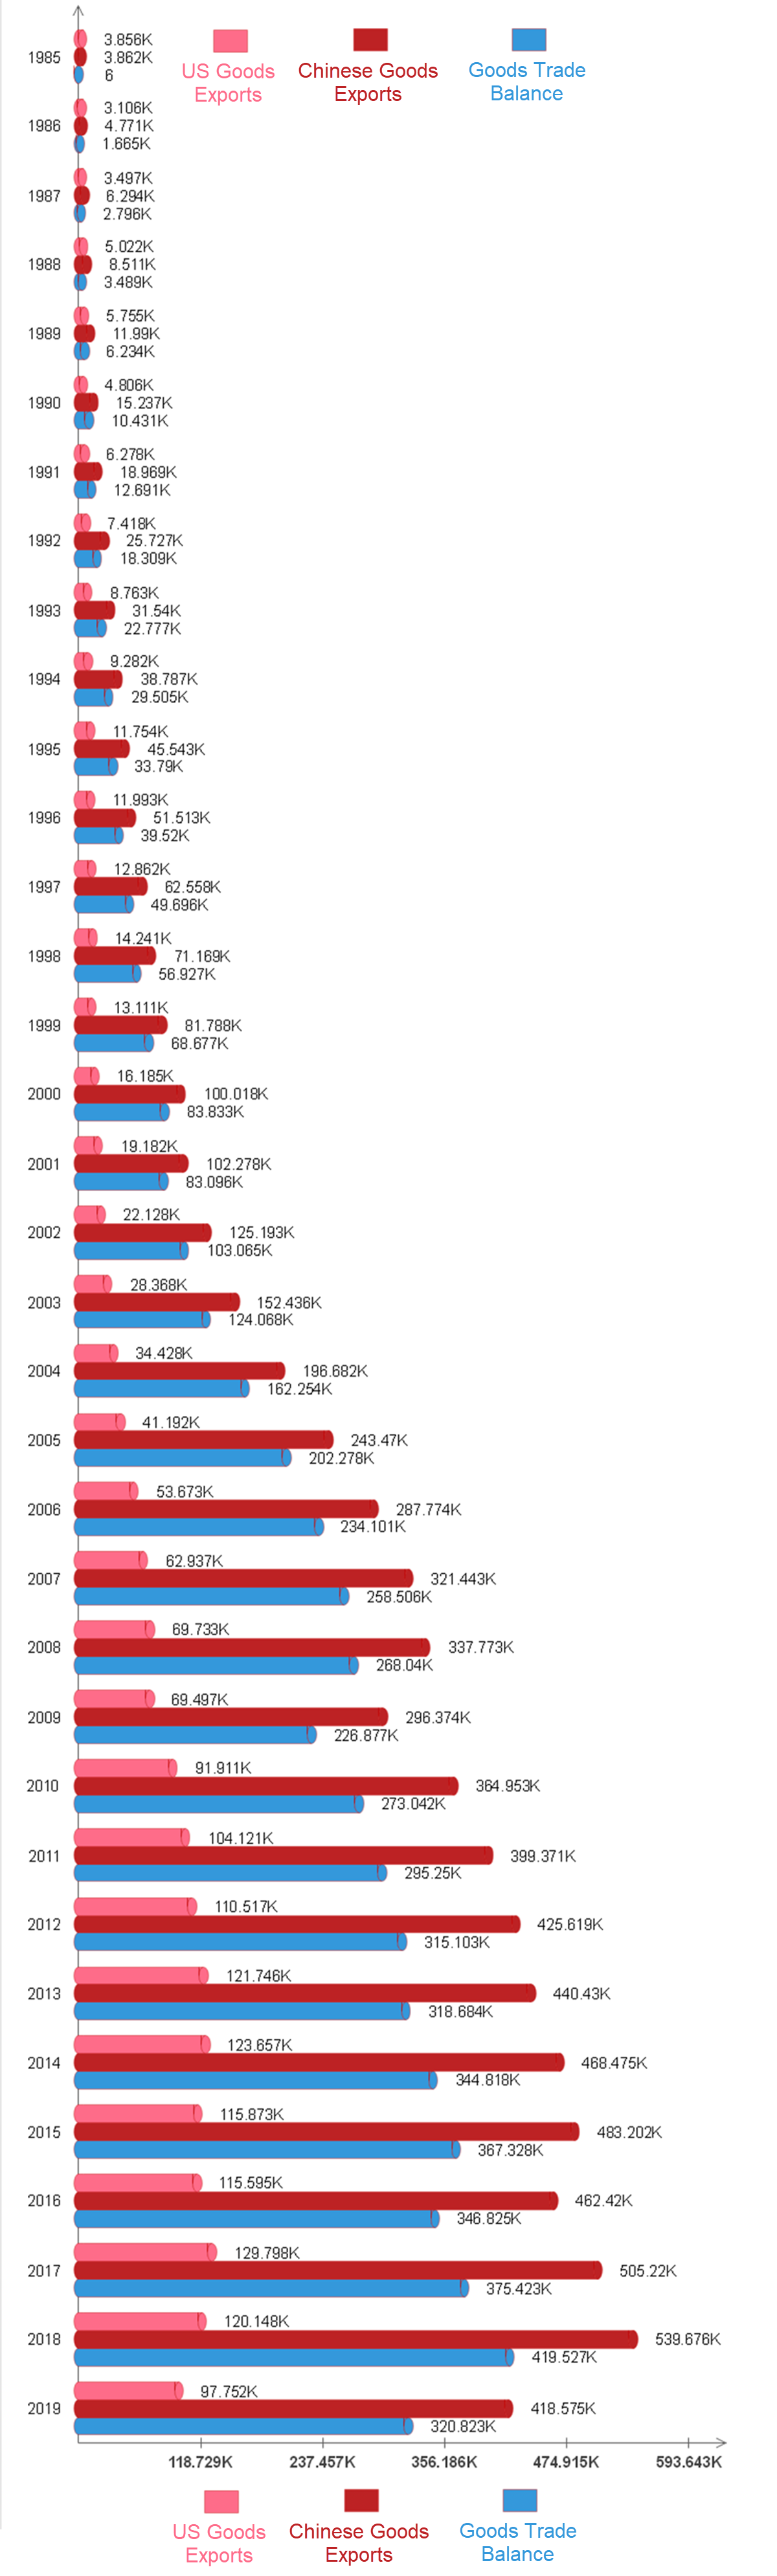
The above graph illustrates U.S. trade in goods with China from 1985 to 2019 from the U.S. Census Bureau. All figures are in millions of U.S. dollars. Imports in red refers to goods from China, while exports in pink refers to U.S. goods sold to China. Note that the balance in blue can be expressed either as a positive goods trade balance for China or a negative goods trade balance for the United States. For visual purposes, the data was expressed as a positive number, repsenting China's goods trade surplus with the United States.


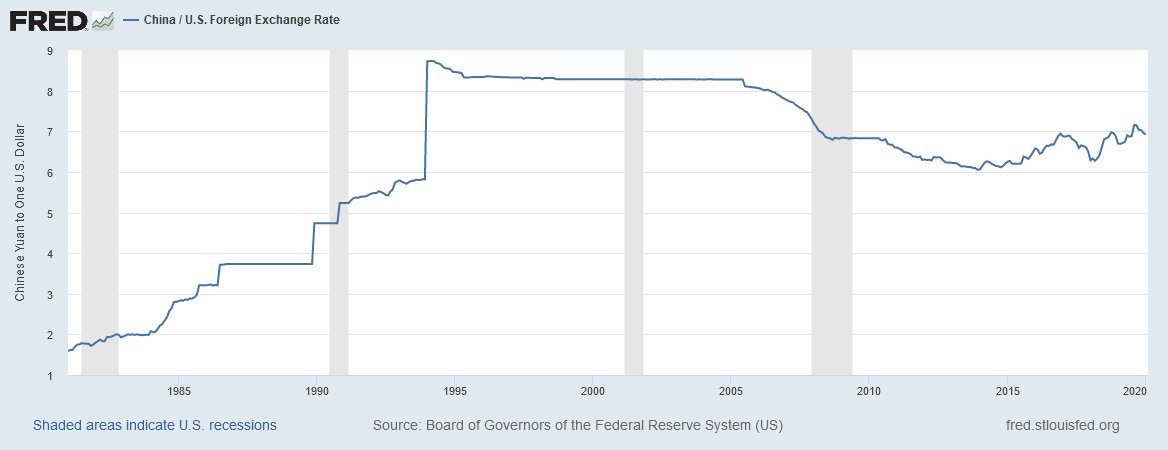
China does not have open capital accounts. The value of their Renminbi (RMB) or Yuan currency is managed by the People's Bank of China (PBOC) to improve their domestic economy. CNBC reports that the currency is allowed to trade within a tight two percent band of the day's midpoint range. If it shifts too far, according to some analysts, the Chinese central bank intervenes to buy or sell Yuan to stabilize its volatility.
In a feature detailing the Yuan's currency development, Reuters report that the currency was pegged at ¥2.46 to 1 U.S. dollar from 1955 to 1971. In January 1981, the State Council fixed the Yuan to ¥2.8 per dollar. When the currency appreciated to 2.1 percent, the Yuan was pegged to ¥8.28 per dollar from 1994 to 2005.
A Business Insider article in 2010 points out that the rise of U.S. dollar in the 1980s, accompanied by the great devaluation of the Chinese Yuan in January 1994, made a favorable exchange rate environment for exporting to China. By holding down the value of the Yuan, China had a large balance of payments surplus which was above $350 billion in 2018.
According to BIIWII.com, China's Central Bank now has the world's largest balance sheet, exceeding the European Central Bank.

In 2019, the New York Times (NYT) published a feature on China's 9-9-6 hustle culture. Many Chinese programmers are now protesting the grueling 6-day work week, starting from 9 a.m. to 9 p.m. daily. According to the NYT:
“For years, Chinese tech employees have worked hours that make Silicon Valley's workaholics seem pampered. Now they are naming and shaming employers that demand late nights. Some programmers are even withholding their creations from companies that they think overemphasize 996.”
Under this culture, people have literally worked themselves to death. A 2016 story in the Straits Times talks about fairer labor provisions following three employee deaths due to over exhaustion. Working to death, referred to as ‘karoshi,' was quite common in Japan. But it seems China has surpassed Japan in terms of the number of deaths every year. In 2014, around 600,000 died of overwork in a year, which makes it about 1,600 deaths per day.
In other cases, some factories lock their doors throughout the workday. This forces employees to render involuntary overtime hours. In 2013, reports revealed that 9 Foxconn employees jumped to commit suicide to escape their dreadful work. In response, the company merely fixed suicide prevention nets.
In Western China, over a million Uyghurs are in Xinjiang re-education camps. These internment camps are a source of cheap labor. Moreover, schoolchildren are sometimes forced to work in sweatshops. The Guardian featured a story in 2019 about children being drafted to make Amazon's Alexa devices in China. The same company, Foxconn, was involved in the issue.

China is known to persistently misappropriate foreign technology. This is the core of the Trump administration's dispute with the country. Chinese intellectual property theft is estimated to cost the U.S. between $225 to $600 billion per year.
In 2015, the Los Angeles Times published a feature about Segway Inc., the original manufacturer of the two-wheeled self-balancing vehicle. The report talks about how Ninebot, a three-year old Beijing company, copied the Segway design. However, even after the accusation, Ninebot eventually bought out Segway for an undisclosed amount.
Furthermore, tech companies working in China may have to work with local partners and be required to transfer their technology. A paper published by the Petersen Institute for International Economics notes that China has deliberately designed foreign policies that force multinational firms to transfer strategically sensitive technologies to Chinese companies. This now occurs in the IT industry as well as in the car manufacturing industry.
With this policy in place, local partners may end up stealing a foreign firm's business model, such as what happened to the Fellowes paper shredders. Fellowes accused its joint venture partner Jiangsu Shinri Machinery Co., Ltd. of taking over their facility without including the Fellowes brand name.
In 2018, the U.S. Government Accountability Office found that 20 out of 47 brand name products it purchased online were counterfeit goods. The FBI's Steve Shapiro stated fake goods cost the United States around $600 billion per year.
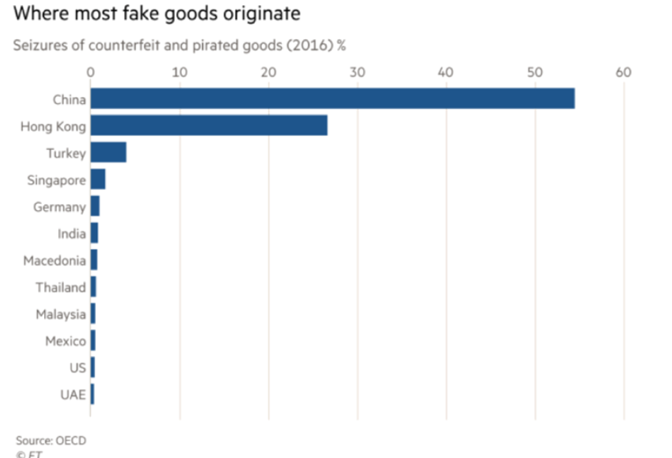
China is a leading source of counterfeit goods. In 2016, the Organization for Economic Co-operation and Development (OECD) estimated that 3.3% of global trade consisted of fake goods. This industry runs at $509 billion per year. Over half of all the fake products originated in China, while Hong Kong made up 25 percent of the counterfeit goods. Both producers make up more than 80 percent of all fake products in the world. The chart below illustrates where most counterfeit products are created in 2016.
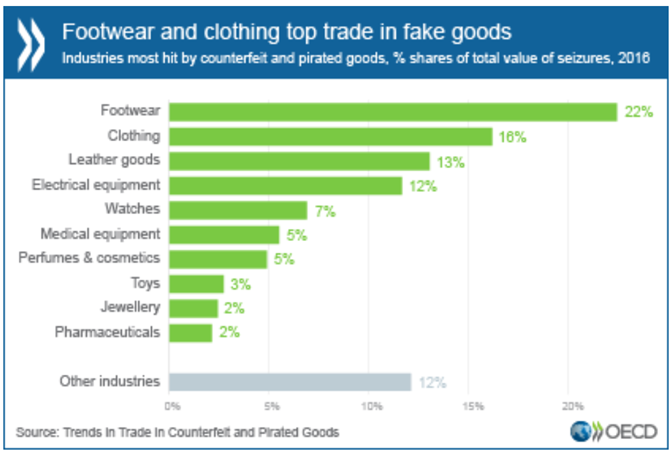
Below is a chart that breaks down which industries were most affected by pirated goods in 2016.

China is known for strictly regulating information among its people. Expect local media platforms to be heavily censored. For instance, people cannot search for the Tiananmen Square Massacre in Baidu when they enter their query. The government generally blocks information they do not want the public to see.
In China, search engines like Google or social media platforms like Facebook and Twitter are blocked. One cannot even access common resources like Wikipedia or high authority news sites like The New York Times.
China further muddies the waters by paying a large army of people to write pro-party propaganda, publishing up to 450 million socila media posts per year.

Despite western politicians promoting green energy sources and cap-n-trade programs, China is rapidly building new coal power plants. These further moves coal supply chains to China, where nothing is prohibiting them from building more coal plants. According to a 2019 feature by Wired, China has 121 gigawatts of coal power plants under construction. That's more than the rest of the world combined.
In 2018, the Guardian reported that the number of pollution sources in China increased by more than half in less than a decade. The country's ministry of ecology and environment announced that pollution sources are at around 9m compared to 5.9m in its previous census in 2010.
The country has major environmental problems, ranging from water pollution, air pollution, and declining biodiversity. It is also facing grave desertification due to growing population, deforestation, and many other infrastructure projects.
China experiences blinding sandstorms with a desert that expands by around 950 square miles each year. The country's constant disregard for the environment has also created places called ‘cancer villages.' These are entire towns so polluted that residing there is considered a huge cancer risk.
Many U.S. rural areas are dying because of outsourced manufacturing services. This phenomenon was discussed in a 2018 article on Axios.com, stating that 73 percent of rural counties had more people move out than move in. This trend was most apparent in the Northeast and Midwest, causing substantial population deficit in many rural U.S. counties.
 J.D. Vance's book, Hillbilly Elegy: A Memoir of a Family and Culture in Crisis, documents the struggle of poor white families which felt left behind during the outbreak of the issue. There are rising deaths due to despair, which coincides with China's mass supply of fentanyl into the U.S.
A 2019 study by RAND Corporation found that deaths from synthetic opioids like fentanyl increased more than ten-fold in five years. These deaths are associated with despair, which is rooted in deep structural and social struggles. The mortalities rose from 3,000 in 2013, to more than 30,000 in 2018. Opioids like fentanyl are now linked to twice as many deaths as heroin. In 2014, there were an estimated 4,585 fentanyl confiscations, which is a seven-fold increase compared to 2012 figures.
According to the Centers for Disease Control and Prevention (CDC), fentanyl is 50 to 100 times more potent than morphine. Moreover, a new fentanyl analog called Carfentanil is 100 times stronger than the common fentanyl.
In 2017, the Financial Times chronicled the rising deaths of despair among white working class people in the U.S. It published research which found that death by drugs, alcohol, and suicide was higher among white men with high school education or less. See the chart below.
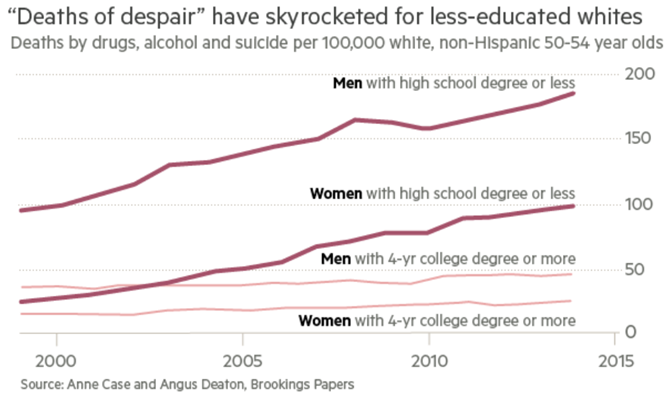
According to the data below, “In 1999 white men and women aged 50-54 with a high school education had a mortality rate 30 per cent lower than black Americans. In 2015 it was 30 per cent higher.”
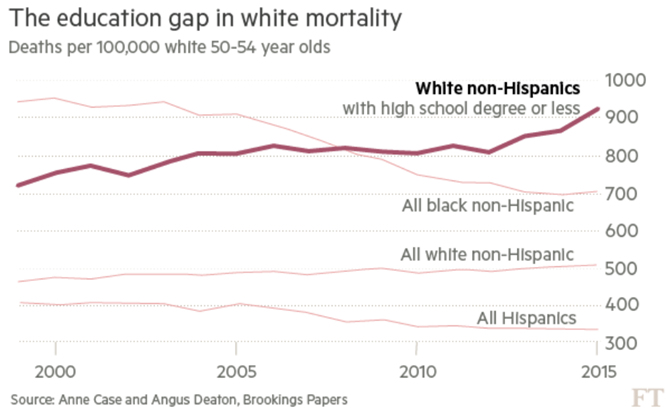
How does this affect American longevity? The Advisory Board states that the rising mortality rates have caused median U.S. life expectancy to decline by 3 years in a row. It dropped from 78.9 years in 2014 to 78.6 years in 2017.
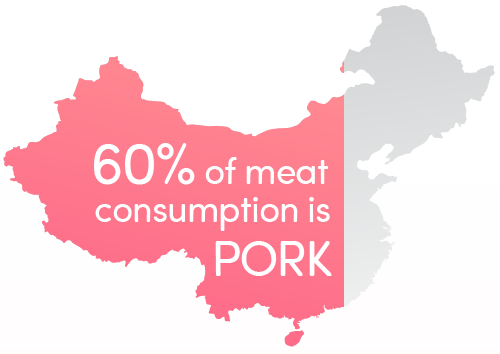
Pork is the most consumed meat in the world. Though it is not considered Kosher or Halal, its popularity is mainly due to its large demand in China. Pork makes up around two-thirds per capita meat consumption in China, states Our World in Data. That's 60 percent of the meat consumed in China.
Statistics from the Food and Agriculture Organization (FAO) of the United Nations show that pigmeat is the highest of meat commodities per capita consumption on a global average. In 2013, the average person consumed around 16 kg of pigmeat. This is followed by 15 kg of poultry and around 9 kg of beef and buffalo meat. Mutton and goat, as well as other meat types, consumed by the average person was only around 2 kg.
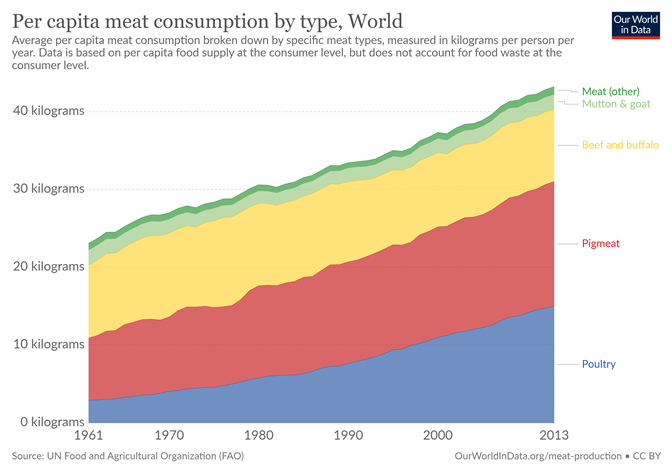
Global 2013 Average Pork Consumption Per Person
| Type of Meat | Weight (kg) |
|---|---|
| Pigmeat | 16.02 kg |
| Poultry | 14.99 kg |
| Beef and buffalo | 9.32 kg |
| Mutton and goat | 1.91 kg |
| Meat (other) | 0.98 kg |
Chinese food history site EatingChina.com states that scientists found one of the earliest proofs of pig domestication in Guanxi, China. Pigs became such a great part of daily life that the Chinese character for ‘roof' 宀 is written above 豕 the character ‘pig,' creating the word ‘home' or ‘family.' 家
Moreover, pigs are considered efficient meat producers, adapting well to life in rural communities. A family can have a hog tied outside their home and left to eat almost anything. The pig is also the 12th and final animal in the Chinese zodiac, which is considered a symbol of wealth.
Because it represents prosperity and good fortune, China consumes the most pork during the Lunar New Year. Some popular pork dishes include Chinese pork dumplings, char siu or barbecued pork, sweet and sour pork, braised pork, and twice cooked pork.
In terms of pigmeat production, the leading countries in 2013 were China (53.75 million tons), followed by the European Union (21.86 million tons), and the United States (9.88 million tons). The graph below is sourced from Our World in Data, which collated statistics from the United Nations FAO.
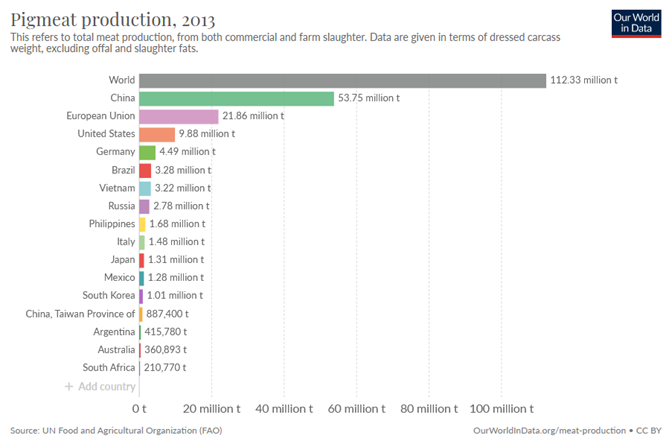
The graph shows that the global production of pork in 2013 reached 112.33 million tons. China, being the leading producer, generated 53.86 million tons of pigmeat. That's around 48 percent of the world's pork supply.
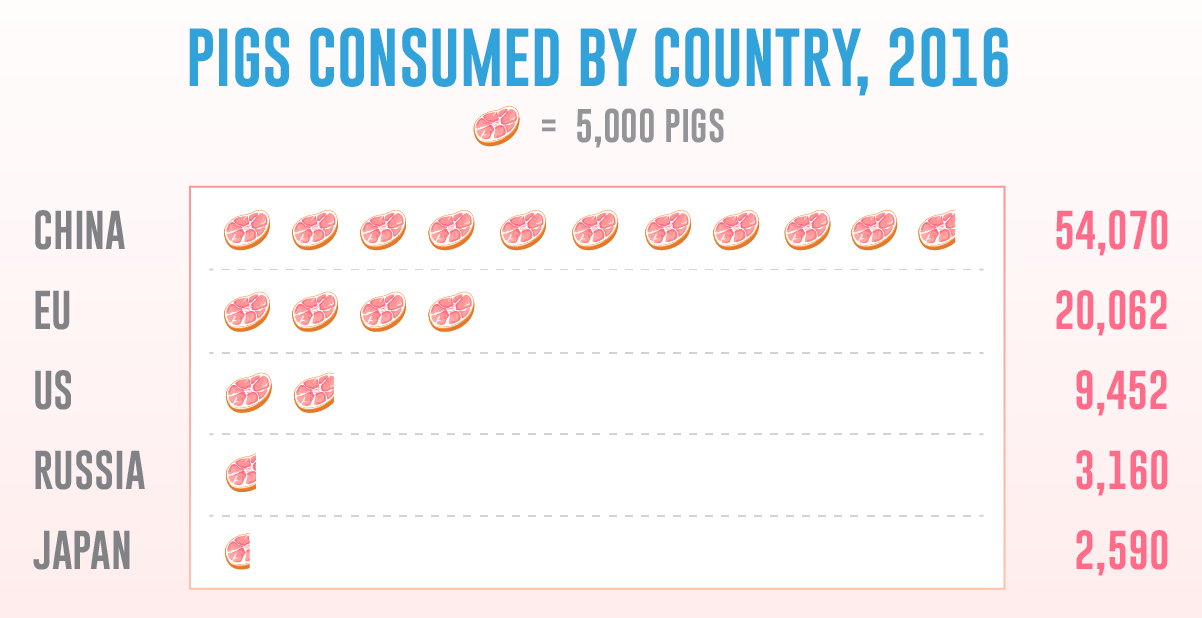
In terms of pork consumption in different countries, the top three nations are still China, the European Union, and the United States. Below is a table that shows the total pork consumption per country in 2016, alongside its pound per capita consumption in 2018.
| Country | 2016 Pork Consumption | 2018 lb. per capita |
|---|---|---|
| China | 55,398 | 88.6 |
| EU | 21,163 | 91.1 |
| United States | 9,748 | 65.3 |
| Brazil | 3,035 | 32.0 |
| Japan | 2,775 | 48.5 |
| Mexico | 2,331 | 40.8 |
| South Korea | 2,001 | 85.8 |
| Philippines | 1,887 | 39.3 |
| Others | 12,589 | 794.2 |
| Total | 110,927 | 1,285.6 |
The table above shows 2016 Pork Consumption data from the USDA, while data under 2018 lb. per capita is from Pork.org.
In an interview with South China Morning Post (SCMP), vice-minister for agriculture Yu Kangzhen stated that the cross-border global pork trade in 2018 reached 8 million metric tons. That's less than 15 percent of China's annual pork production, which is 54 million metric tons.
The Chinese hog industry has an estimated value of $1 trillion, with up to $140 billion in annual turnover. Bloomberg reports that China's hog market was worth $118 billion in 2018, dominating global pork sales.
On the other hand, the U.S. pork industry is estimated at $23 billion, according to a report by Reuters. Though this is nowhere close to China's, the U.S. is the world's largest exporter of pork products. The North Carolina Pork Council (NC Pork) states that the U.S. exports nearly $6 billion worth of pork annually.
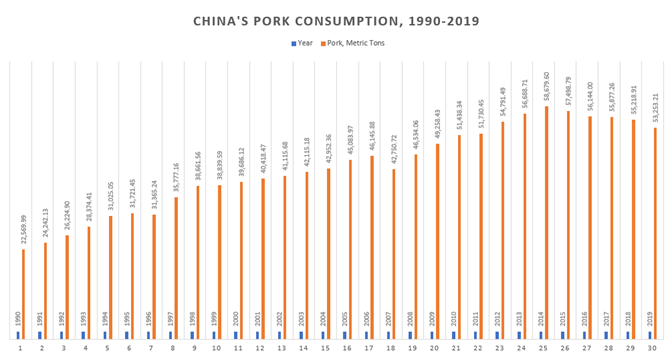
Apart from global trade in the hog industry, let's take a look at how much pork China consumes every year. Below is a chart detailing China's pork consumption in metric tons, from 1990 to 2019. The data was taken from the Organization for Economic Co-operation and Development (OECD).
| Year | Pork, Metric Tons | Year | Pork, Metric Tons |
|---|---|---|---|
| 1990 | 22,569.99 | 2005 | 45,083.97 |
| 1991 | 24,242.13 | 2006 | 46,145.88 |
| 1992 | 26,224.90 | 2007 | 42,750.72 |
| 1993 | 28,374.41 | 2008 | 46,534.06 |
| 1994 | 31,025.05 | 2009 | 49,258.43 |
| 1995 | 31,721.45 | 2010 | 51,438.34 |
| 1996 | 31,365.24 | 2011 | 51,730.45 |
| 1997 | 35,777.16 | 2012 | 54,791.49 |
| 1998 | 38,661.56 | 2013 | 56,688.71 |
| 1999 | 38,839.59 | 2014 | 58,679.60 |
| 2000 | 39,686.12 | 2015 | 57,498.79 |
| 2001 | 40,418.47 | 2016 | 56,144.00 |
| 2002 | 41,115.68 | 2017 | 55,877.26 |
| 2003 | 42,115.18 | 2018 | 55,218.91 |
| 2004 | 42,952.36 | 2019 | 53,253.21 |
The table above represents the figures in China's Pork Consumption, 1990 – 2019 graph from OECD.
Based on the table, China consumed 22,569.99 metric tons of pork in 1990. It maintained an upward trend, increasing by 20,000 to 30,000 tons each year until 2006.
Pork consumption declined from 46,145.88 metric tons in 2006, to 42,750.72 metric tons in 2007. This was due to an outbreak of blue ear pig disease, also known as PRRS or Porcine Reproductive and Respiratory Syndrome. The outbreak led to pork shortage and inflation of prices. By 2008, pork consumption rates seemed to recover at 46,534.06 metric tons and steadily rose each year until 2014 (57,498.79 metric tons).
However, China's pork consumption steadily decreased from 2015 to 2019. Reports from Reuters and the Washington Post explains the decline can be partly due to PRRS. An extended period of losses from 2013 to 2015 urged farmers to cull millions of pigs. This lessened pork supply and prompted pork price inflation in 2016.
Pigmeat consumption dropped to 55,218.91 metric tons in 2018, when African Swine Fever (ASF) infected millions of pigs in China. Once again, massive culling prompted pork shortage and a surge in pork prices. By 2019, pork consumption further decreased to 53,253.21 metric tons.
To anticipate the holidays, especially the January Lunar New Year, China released over 100,000 metric tons of frozen pork reserves, according to Reuters.
How much pork is the average Chinese citizen projected to eat? By 2026, the average Chinese is expected to consume 55 kg or 121 lbs. of pork per year. That's 10 percent more compared to 2017, which is around 50 kg. This is based on a report by the Organization for Economic Cooperation and Development and the United Nation's FAO.
| Months in 2019 | % Year-on-year Pork Price Inflation | Estimated Pork Price per kg |
|---|---|---|
| July | 27% | $2.25 |
| August | 46.7% | $3.66 |
| September | 69.3% | $5.31 |
| October | 101.3% | $7.75 |
| November | 110.2% | $8.45 |
| December | 97% | $7.35 |
Data from news bureaus mentioned below.
In October 2019, Bloomberg reported that the ASF crisis inflated pork prices by 21 percent in China. This is the biggest price hike in 15 years since it jumped to 34 percent in 2004. Pigmeat's high demand in 2004 was due to the outbreak of mad cow disease and bird flu.
According to SCMP, China's year-over-year pork prices rose by 46.7 percent from August 2018 to August 2019. That's a huge increase compared to the 27 percent year-on-year from July 2018 to July 2019. Come September 2019, CNBC reports it surged to 69.3 percent compared to the previous year.
Pork price inflation hit 101 percent in October 2019, costing as high as ¥53.79 ($7.75) per kilogram of pork. In November 2019, the year-on-year pork price rose to 110 percent, according to CNBC. By December 2019, SCMP reports that China's pork price inflation hit 97 percent. That's ¥50.99 ($7.35) per kilogram. In an interview with a meat trader, SCMP notes how pork was priced at ¥25 ($3.57) in 2018 but was priced as high as ¥60 ($8.65) in 2019.
According to the Wall Street Journal (WSJ), the rising pork prices drove the highest Chinese consumer price inflation since 2012. China's consumer-price index rose to 4.5 percent in November 2019 compared to the previous year.
The table below shows China's monthly percentage change in pork prices from November 2018 to November 2019. 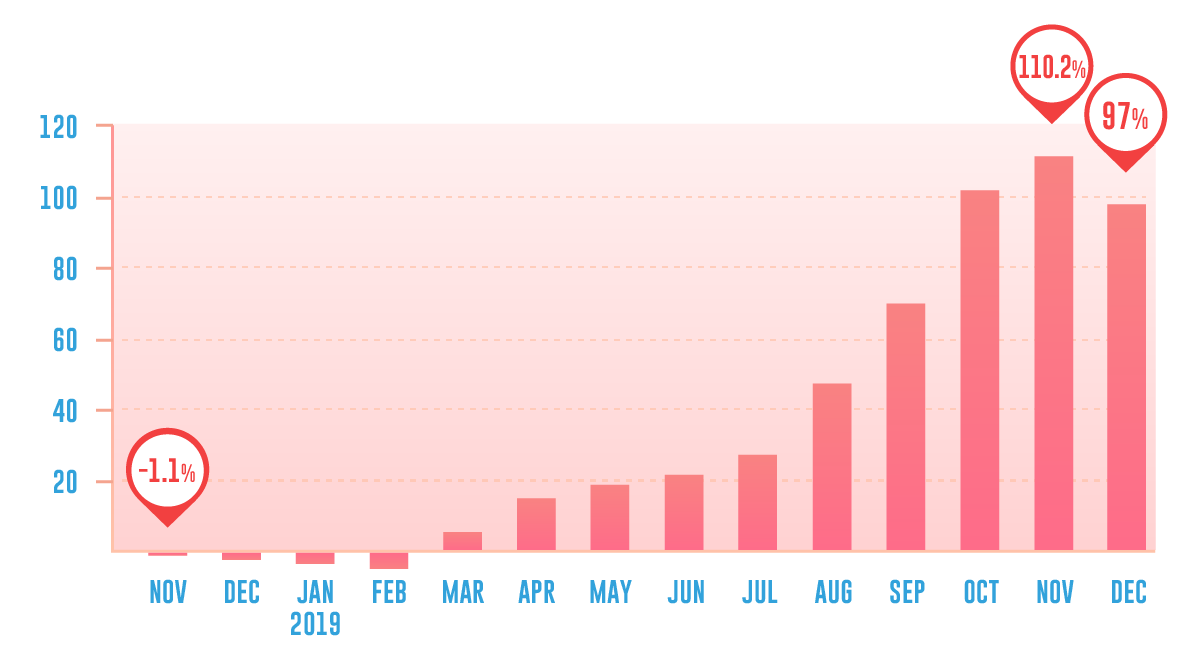
| Month | % Change in Pork Prices |
|---|---|
| Nov 2018 | -1.1% |
| Dec 2018 | -1.5% |
| Jan 2019 | -3.2% |
| Feb 2019 | -4.8% |
| Mar 2019 | 5.1% |
| Apr 2019 | 14.4% |
| May 2019 | 18.2% |
| Jun 2019 | 21.1% |
| July 2019 | 27% |
| Aug 2019 | 46.7% |
| Sep 2019 | 69.3% |
| Oct 2019 | 101.3% |
| Nov 2019 | 110.2% |
The table above represents figures in China's Pork Prices Monthly Percentage Increase graph.
How does China's pork shortage impact other countries? Prior to the outbreak of ASF, pork prices per kilogram around the world did not cost as much. Below is a table listing the price of pork in selected countries, as well as their global production share between 2015 and 2016. This gives a rough estimate of how much pork cost per kilogram in different countries before China's pork crisis.
| Location | $ / kg | Global Share |
|---|---|---|
| Russia | $5.43 | 2.9% |
| Poland | $4.60 | 1.7% |
| China | $4.32 | 45.8% |
| Spain | $3.47 | 3.3% |
| Brazil | $2.61 | 3.0% |
| Global Average | $3.39 | |
| Vietnam | $2.37 | 3.1% |
| United States | $1.38 | 9.6% |
Data from Tridge.com
After China's ASF outbreak in August 2018, pork prices inevitably rose around the world. The Guardian reports that cost of pork in Europe increased by at least 35 percent in the beginning of 2019.
In the U.S., WSJ notes that hog futures have increased by 52 percent, while hog carcass prices rose to 23 percent in 2019, based on U.S. Department of Agriculture (USDA) data. The same report also states that the price of pork trimmings has nearly doubled.
Bloomberg sourced online retail data and compiled bacon prices around the world in 2019. The table below is a list of bacon prices per 500 grams in 19 different cities. It's arranged from the city with the highest to the lowest price.
| City | 500 grams of Bacon |
|---|---|
| Tokyo | $17.21 |
| Hong Kong | $12.75 |
| Beijing | $10.79 |
| Paris | $10.24 |
| Lisbon | $9.52 |
| Taipei | $9.50 |
| Bangkok | $8.22 |
| Bucharest | $8.20 |
| Seoul | $7.54 |
| Auckland | $7.35 |
| Copenhagen | $7.18 |
| New York | $6.99 |
| Riga | $6.38 |
| London | $5.79 |
| Johannesburg | $5.39 |
| Melbourne | $5.12 |
| Buenos Aires | $4.72 |
| Prague | $4.70 |
| Warsaw | $4.48 |
Data from Bloomberg.com
Based on the table, bacon is most expensive in Tokyo ($17.21), followed by Hong Kong ($12.75), and Beijing ($10.79). The average price of bacon from this set is around $8, and the cheapest is above $4. Bacon prices are lowest in these European cities: Warsaw ($4.48), Prague ($4.70), and Buenos Aires ($4.72).
Apart from the increasing pork prices, ASF from China has spread into neighboring Asian countries. The situation added further strain among pork farmers and sellers in the affected countries. PorkBusiness.com reports that ASF infected pigs in the following nations:
Rising food prices are dangerous for social stability. If a man can no longer feed his family and he blames the government for the change he is likely to revolt.
In the final blow off top in 2007 to 2008 expanding global money supply led grain prices to rise about 37 percent in Egypt. After the Great Recession of 2008-2009, central banks around the world eased monetary policy to stimulate economic growth. The lower rates urged consumers to borrow more money, which further increased the money supply. However, this also caused widespread food price inflation. Consequently, it fueled public rallies known as the Arab Spring. The movement sparked a series of anti-government protests across the Middle East, which began in December 17, 2010.
A PBS report in 2011 explored how rising food prices prompted the anti-government sentiment. It confers how resources like water and land are insufficient to sustain food supplies in the Arab world. Because of this, 50 percent of food consumed in the Middle East and North Africa is imported. The rising food prices, together with shrinking farmlands and poor water distribution, likely contributed to political unrest.
In related news, the Guardian reported how high food prices, especially that of bread, were crucial in instigating the Arab Spring. The article notes that the Arab Spring rallies in December 2010 were first dismissed as ‘bread riots,' which were common in Egypt since the late 1980s.
Along with increasing unemployment rates, many people across Egypt relied on subsidized bread for sustenance. Food price inflation continued rising for years, reaching 18.9 percent before February 2011.

Despite being twice as expensive, many Chinese families still prefer to serve pigmeat. Al Jazeera reported that many Chinese shoppers seemed unbothered by the high prices of pork during the Lunar New Year.
In the article, Shi Xinzhong, owner of Mr. Shi's Dumplings restaurant in Beijing, states that most restaurants have integrated the high cost of pork meat. This means they do not pass it on to their customers. Many families also plan on eating at restaurants during the Lunar New Year, where pork is still available.
Meanwhile, other businesses are taking advantage of the price hike to market their services. Some small local banks are offering expensive pork in exchange for opening a bank account. According to SCMP, Linhai Rural Commercial Bank made their clients qualify for a lottery that offered several grams of pork. As long as clients deposited ¥10,000 in a three-month time deposit, they are eligible to join the lottery.

In contrast, the skyrocketing prices drove others to look for alternative protein sources. In January 2020, SCMP published a feature about China's growing interest in dog and cat meat amidst the ASF crisis.
Throughout history, certain regions in China have a longstanding tradition of eating dog meat. According to the report, animal rights groups state that as many as 10 million dogs are consumed every year, some saying that pets are poisoned or stolen from their owners. But this time around, pork vendors seem worried because consumers are buying dog or cat meat at much lower prices. Here are quotes from SCMP:
“They have taken away a lot of our business this year because now dog meat, as well as cat meat, is cheaper than pork and beef.”
-Guilin wet market vendor
When asked why he prefers dog meat, Luo Liu states that it's the better option:
“Dog meat tastes better than pork. Why not choose dog meat to treat guests, because it's no longer affordable to order pork?”
- Luo Liu, Jiangxi resident


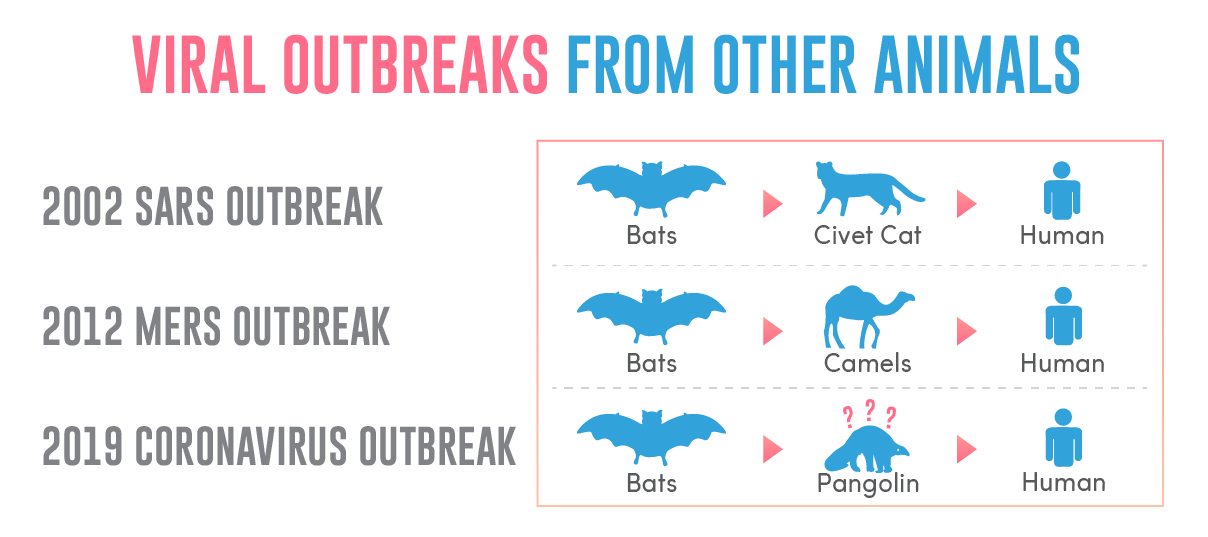
News sources suggest that the recent coronavirus outbreak (COVID-19), which originated in Wuhan, China, likely began in the city's Huanan Seafood market. According to Business Insider, live animals such as snakes, civet cats, foxes, badgers, bamboo rats, and hedgehogs were sold there. The article states that experts think the Wuhan coronavirus may have jumped from bats to snakes, and then to people. Bats have been the cause of at least 4 pandemics. Researchers later suggested the coronavirus may have spread from bats to pangolins to humans, though they caution further analysis is still required:
After testing more than 1,000 samples from wild animals, scientists at the South China Agricultural University found that the genome sequences of viruses in pangolins to be 99% identical to those on coronavirus patients, the official Xinhua news agency reported.
But other experts urged caution. “This is not scientific evidence,” said James Wood, head of the department of veterinary medicine at the University of Cambridge. “Investigations into animal reservoirs are extremely important, but results must be then be published for international scrutiny.”
In response, the World Health Organization (WHO) released public health advice warning against the consumption of raw or undercooked animal products. The health bureau states: “Raw meat, milk, or animal organs should be handled with care, to avoid cross-contamination with uncooked foods.”
An NPR feature also notes that cooking an infected animal until the meat is about 150 degrees Fahrenheit deactivates coronavirus. To date, Chinese authorities have since banned the sale of wild animals, states China Daily to help contain the infection.
The Financial Times states that Chinese media reported 27 cases of an unknown type of respiratory ailment in Wuhan as early as December 31. However, the city's bestselling commercial newspaper, the Wuhan Evening News, did not report the outbreak on its front page from January 6 to January 19. Chinese censors regulated media to only announce reports sanctioned by the government. But by January 9, 2020, WHO already informed the public about the flu-like virus in China.
Apart from China, Time.com states that dozens of people across the globe have tested positive for the Wuhan coronavirus. Since the virus was not contained early on, it spread in neighboring countries as well as Western regions. These countries include Thailand, Hong Kong, Singapore, Cambodia, Vietnam, South Korea, Malaysia, Sri Lanka, Japan, Australia, France, Germany, and many more.
The first case linked to the 2019 novel coronavirus happened on December 1st. Wuhan doctor Li Wenliang warned about 7 people coming down with pnemonia & was promptly forced to sign a confession for criminal activity for mentioning the rapidly developing crisis. He later died from the the disease, leaving behind a pregnant wife who also contracted the disease. On Chinese microblog platform Weibo a hashag for 'Wuhan Sars" was trending until censors deleted it.
It is estimated 50,000 people daily are contracting the disease in China.
Your questions on #CoronaVirus #2019nCoV answered:@neil_ferguson on estimates, scale of the epidemic, forward projections, the role of modelling in outbreak response, informing governments, interventions, control measures & more
— MRC Centre for Global Infectious Disease Analysis (@MRC_Outbreak) February 5, 2020
Watch the full video: 🔰https://t.co/Mp5MpxhQ6A pic.twitter.com/pvNwLUsogo
As of February 9, 2020 the novel coronavirus has officially killed 811, more people than the number who perished from the 2002 SARS virus outbreak. As of February 12, 2020, there have been a total of 1,368 deaths, with 5,977 patients who have recovered from a total confirmed case load of 60,312.
Below is a list of confirmed cases due to the outbreak. You can find the latest data here.
Confirmed COVID-19 Cases as of February 10, 2020
| Province/State | Country/Region | Last Update | Confirmed | Deaths | Recovered |
|---|---|---|---|---|---|
| Hubei | Mainland China | 2/9/2020 23:33 | 29631 | 871 | 1795 |
| Guangdong | Mainland China | 2/10/2020 3:43 | 1151 | 1 | 147 |
| Zhejiang | Mainland China | 2/10/2020 1:13 | 1092 | 0 | 201 |
| Henan | Mainland China | 2/10/2020 1:13 | 1073 | 6 | 169 |
| Hunan | Mainland China | 2/10/2020 2:13 | 879 | 1 | 186 |
| Anhui | Mainland China | 2/10/2020 2:03 | 830 | 3 | 73 |
| Jiangxi | Mainland China | 2/10/2020 1:23 | 771 | 1 | 102 |
| Jiangsu | Mainland China | 2/10/2020 1:43 | 492 | 0 | 72 |
| Chongqing | Mainland China | 2/9/2020 23:53 | 468 | 2 | 51 |
| Shandong | Mainland China | 2/10/2020 0:43 | 459 | 1 | 63 |
| Sichuan | Mainland China | 2/10/2020 1:03 | 405 | 1 | 76 |
| Beijing | Mainland China | 2/10/2020 3:13 | 337 | 2 | 44 |
| Heilongjiang | Mainland China | 2/10/2020 0:33 | 331 | 7 | 15 |
| Shanghai | Mainland China | 2/10/2020 1:33 | 295 | 1 | 44 |
| Fujian | Mainland China | 2/10/2020 1:13 | 261 | 0 | 35 |
| Hebei | Mainland China | 2/10/2020 0:23 | 218 | 2 | 35 |
| Shaanxi | Mainland China | 2/10/2020 2:23 | 213 | 0 | 26 |
| Guangxi | Mainland China | 2/10/2020 2:03 | 210 | 1 | 18 |
| Yunnan | Mainland China | 2/9/2020 8:53 | 141 | 0 | 18 |
| Hainan | Mainland China | 2/10/2020 0:43 | 136 | 3 | 19 |
| Shanxi | Mainland China | 2/9/2020 23:43 | 119 | 0 | 25 |
| Guizhou | Mainland China | 2/10/2020 1:33 | 109 | 1 | 7 |
| Liaoning | Mainland China | 2/9/2020 12:23 | 107 | 0 | 12 |
| Tianjin | Mainland China | 2/10/2020 3:43 | 94 | 1 | 4 |
| Gansu | Mainland China | 2/9/2020 23:33 | 83 | 2 | 16 |
| Jilin | Mainland China | 2/10/2020 0:33 | 80 | 1 | 12 |
| Diamond Princess cruise ship | Others | 2/9/2020 6:13 | 64 | 0 | 0 |
| Inner Mongolia | Mainland China | 2/10/2020 2:43 | 58 | 0 | 5 |
| Ningxia | Mainland China | 2/10/2020 1:43 | 49 | 0 | 13 |
| Xinjiang | Mainland China | 2/10/2020 1:13 | 49 | 0 | 0 |
| Singapore | 2/10/2020 3:03 | 43 | 0 | 2 | |
| Hong Kong | Hong Kong | 2/10/2020 0:03 | 36 | 1 | 0 |
| Thailand | 2/8/2020 12:53 | 32 | 0 | 10 | |
| South Korea | 2/10/2020 3:03 | 27 | 0 | 3 | |
| Japan | 2/9/2020 6:13 | 26 | 0 | 1 | |
| Qinghai | Mainland China | 2/6/2020 2:13 | 18 | 0 | 3 |
| Malaysia | 2/10/2020 3:03 | 18 | 0 | 1 | |
| Taiwan | Taiwan | 2/9/2020 9:13 | 18 | 0 | 1 |
| Germany | 2/9/2020 6:13 | 14 | 0 | 0 | |
| Vietnam | 2/10/2020 3:03 | 14 | 0 | 1 | |
| France | 2/8/2020 9:53 | 11 | 0 | 0 | |
| Macau | Macau | 2/6/2020 14:23 | 10 | 0 | 1 |
| United Arab Emirates | 2/8/2020 7:03 | 7 | 0 | 0 | |
| Queensland | Australia | 2/9/2020 19:33 | 5 | 0 | 0 |
| New South Wales | Australia | 2/6/2020 3:13 | 4 | 0 | 2 |
| Victoria | Australia | 2/1/2020 18:12 | 4 | 0 | 0 |
| British Columbia | Canada | 2/7/2020 5:43 | 4 | 0 | 0 |
| India | 2/3/2020 21:43 | 3 | 0 | 0 | |
| Italy | 2/7/2020 17:53 | 3 | 0 | 0 | |
| Philippines | 2/7/2020 16:43 | 3 | 1 | 0 | |
| UK | 2/7/2020 18:33 | 3 | 0 | 0 | |
| South Australia | Australia | 2/2/2020 22:33 | 2 | 0 | 0 |
| Toronto, ON | Canada | 2/4/2020 0:13 | 2 | 0 | 0 |
| Russia | 1/31/2020 16:13 | 2 | 0 | 0 | |
| Spain | 2/9/2020 20:33 | 2 | 0 | 0 | |
| Chicago, IL | US | 2/9/2020 19:03 | 2 | 0 | 2 |
| San Benito, CA | US | 2/3/2020 3:53 | 2 | 0 | 0 |
| Santa Clara, CA | US | 2/3/2020 0:43 | 2 | 0 | 0 |
| Belgium | 2/4/2020 15:43 | 1 | 0 | 0 | |
| Cambodia | 1/31/2020 8:15 | 1 | 0 | 0 | |
| London, ON | Canada | 2/4/2020 0:03 | 1 | 0 | 0 |
| Finland | 1/31/2020 8:15 | 1 | 0 | 0 | |
| Tibet | Mainland China | 2/1/2020 1:52 | 1 | 0 | 0 |
| Nepal | 1/31/2020 8:15 | 1 | 0 | 0 | |
| Sri Lanka | 2/8/2020 3:43 | 1 | 0 | 1 | |
| Sweden | 2/1/2020 2:13 | 1 | 0 | 0 | |
| Boston, MA | US | 2/1/2020 19:43 | 1 | 0 | 0 |
| Los Angeles, CA | US | 2/1/2020 19:53 | 1 | 0 | 0 |
| Madison, WI | US | 2/5/2020 21:53 | 1 | 0 | 0 |
| Orange, CA | US | 2/1/2020 19:53 | 1 | 0 | 0 |
| Seattle, WA | US | 2/9/2020 7:03 | 1 | 0 | 1 |
| Tempe, AZ | US | 2/1/2020 19:43 | 1 | 0 | 0 |
Data from Johns Hopkins University CSSE (Uses data from WHO, NHC, and Dingxiangyuan)
All statistics are fluid subject to revision: "The number of officially diagnosed coronavirus cases in the Chinese province of Hubei surged by 45% to nearly 50,000 after the Hubei provincial government began adding cases that were confirmed via imaging scans, alongside those confirmed with the previous method of nucleic acid testing kits."


ASF is a viral disease that only affects pigs, states Pork.org. Therefore, it is not a health issue to humans. The condition is caused by an unclassified virus which is similar to Iridovirus or Poxvirus.
Symptoms in pigs include fever, coughing, vomiting and diarrhea, and discharges secreted in the eye and nose. This makes it most contagious to pigs that have direct contact with infected livestock. Pigs mainly contract the virus through the consumption of contaminated feeds.
Death can occur between two to sever weeks, with mortality rates between 30 to 70 percent. However, a study in Frontiers in Veterinary Science states that ASF can cause a mortality rate of 100 percent within a few weeks. ASF affects 77 percent of the world's swine population.
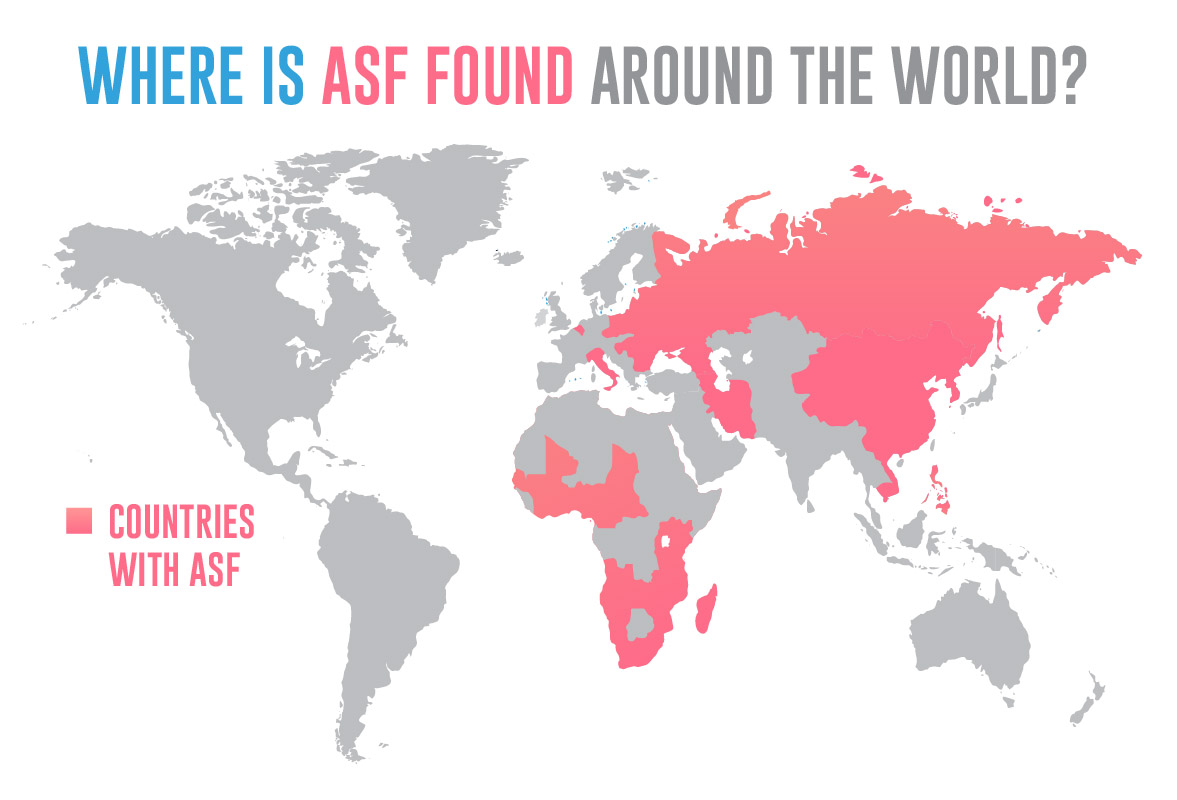
Where is ASF found around the world? According to the USDA, ASF is found in countries throughout the world, more specifically in sub-Saharan African regions. But it has spread to all 31 provinces of China, as well as countries like Mongolia, Laos, Cambodia, Korea, Philippines, and Vietnam. ASF is also found in some parts of the European Union.
After the ASF outbreak in 2018, Vietnam has destroyed around 1.2 million pigs. But China, which produces nearly half of the world's pig population, has lost millions of pigs due to the disease. So far, there have been no cases of ASF infection in the U.S. Reuters states that if the disease spreads in America, 77.3 million pigs will be at risk. But China, which produces nearly half of the world's pig population, has lost an estimated 200 million pigs since 2018.
As China struggled to stop ASF, many farms resorted to mass live-pig burials.
Last year, Chinese pigs got swine flu
— Anil (@anilvohra69) February 9, 2020
and were buried alive for the greater good.
This year, Chinese humans got the Wuhanvirus,
and have been sealed in their city for the greater good.
Frightening parallel.
pic.twitter.com/u086aAYRzl

In response, Chinese government officials vowed to crack down on the mass burials amid protests from international animal welfare groups.
Analysts said China's pork production would fall by 25 percent or 13 million tons due to ASF in 2019. Meanwhile, SCMP reported that Chinese pig inventories dropped by 32.2 percent in July 2019. Rabobank estimated the full-year herd loss at 55%.

Furthermore, there are Chinese criminal gangs taking advantage of the situation. SCMP details how these groups use drones to spread contamination. They threaten farmers and force them into selling their livestock for less. Individual gangs have smuggled up to 4,000 pigs a day, earning at least $143 per pig.
An article by Bloomberg details China's strong pig production, which dwindled after the ASF outbreak. The news bureau gathered data from the U.S. Department of Agriculture, showing China's yearly pig production from 2015 onward. See the table below.
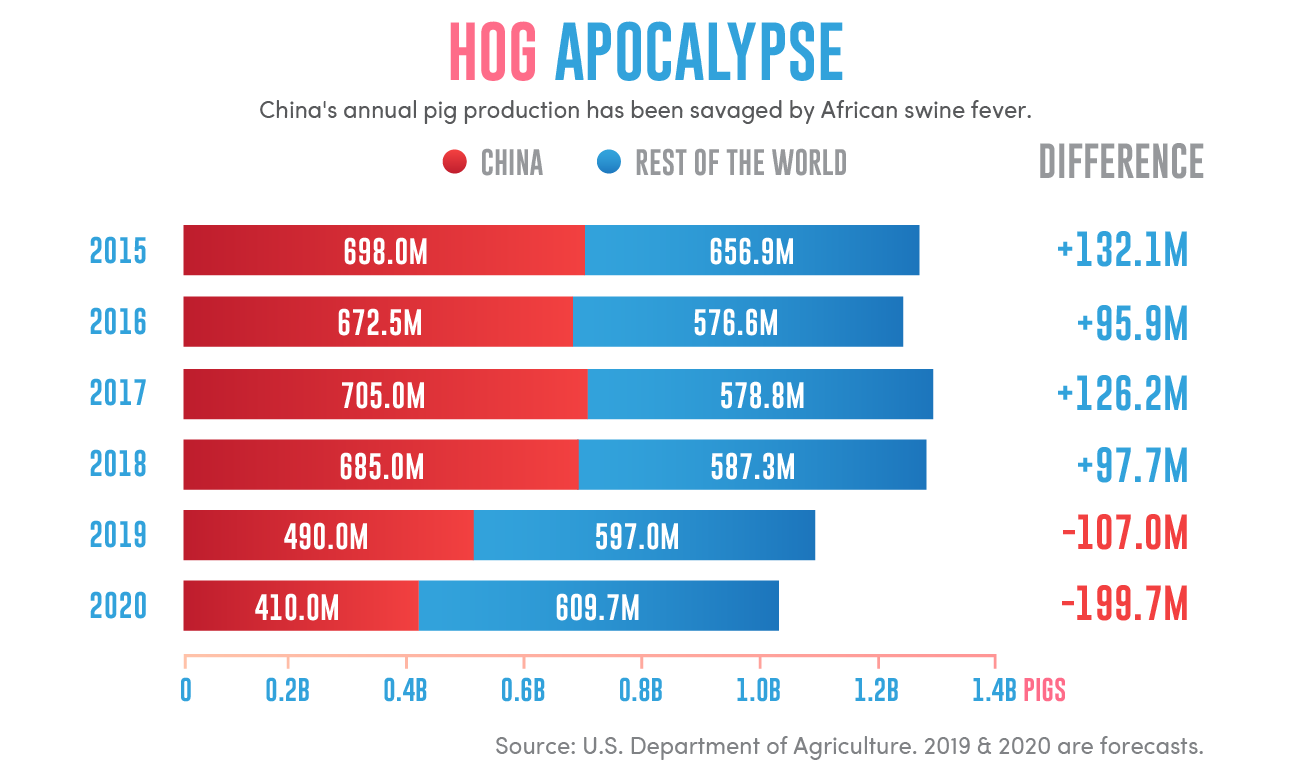
| Year | China's Pig Production | Rest of the World | Total | China's Market Share |
|---|---|---|---|---|
| 2015 | 698.0 M | 565.9 M | 1.3 B | 53.69% |
| 2016 | 672.5 M | 576.6 M | 1.2 B | 56.04% |
| 2017 | 705.0 M | 578.8 M | 1.3 B | 54.23% |
| 2018 | 685.0 M | 587.3 M | 1.3 B | 52.69% |
| 2019 | 490.0 M | 597.0 M | 1.1 B | 44.54% |
| 2020 | 410.0 M | 609.7 M | 1.0 B | 41.00% |
The table above breaks down Bloomberg's data on the world's pig production between 2015 to 2020. Note that at at the time, data for 2019 and 2020 were forecasts.
Based on the data, China's pig production exceeded the rest of the world by 126.2 million in 2017. By 2018, this dropped to 97.7 million, though they still produced more pigs than the rest of the world.
However, after the ASF outbreak, data predicted that the rest of the world will produce 107.0 million more pigs than China. And in 2020, the world's pig production will exceed China's pork industry by 199.7 million. This is the foreseen trend if China does not recover soon from ASF.

Farmers and researchers are exhausting possible ways to tackle the pork shortage. Some of these solutions include the following:
Farming More Pigs and Alternative Sources
To address the severe pork shortage, Chinese farmers who previously did not produce pork have begun raising pigs. Other farmers shifted to alternative meat sources, such as chicken. However, when farmers make the shift at the same time, this means most of the profits go to wholesalers.
The Omnipork
Some businessmen are capitalizing on the crisis by selling ‘meatless meat' options. Green Common is a Hong Kong-based provider and retailer that offers Beyond Meat products in the Asia Pacific. They developed Omnipork with Chinese tastes in mind. It's available online and supermarkets in countries such as Hong Kong, Taiwan, Singapore, and Thailand.
High-voltage Enclosures
Scientists are developing high-voltage pigsties to eliminate ASF. A farm in Hubei, China used this strategy and reported that none of their pigs died from ASF. The team, led by government scientist Prof. Liu Binjiang, operates on the theory that high electric discharges can break down chemicals like ammonia that produces bad odors. This eliminates biological aerosols by 50 to 90 percent, and even kills germs. The scientists assure that the device will use a cable with low electron volume. This makes it safe for animals and farmers.
Genetically Engineered Super Pigs
DNA researchers are taking experimentally bred hogs with bio-engineered genes for regulating heat. Their top priority is to make healthier pigs that are resistant to diseases such as ASF. China spends more than any other country on research and development, except the U.S., which spent $445 billion in 2017.
Breeding Giant Pigs
Bloomberg reports that China has started breeding pigs as heavy as polar bears. In the Zhengzhou city of Henan, a farm is able to raise a pig that weighs 1,653 lbs. Male polar bears usually weigh around 772 – 1,543 lbs., while adult females weigh half of that. Pigs that weigh 1,102 lbs. can sell for over ¥10,000 ($1,400). SCMP notes that breeders in Jilin are raising pigs that weigh an average of 385 to 440 lbs. The typical weight of a pig is around 275 lbs.
Releasing Strategic Emergency Pork Reserves
Reuters states China released 40 tons of frozen pork from its emergency reserves in December 23, 2020. This is to ensure sufficient supply in the January Lunar New Year.
China Aims to be a Self-Sufficient Pork Producer
The country intends to produce around 95 percent of its pork consumption domestically. Essentially, this approach will help reduce the kind of import risks which prompted the Arab Spring protests. In spite of that, China dramatically increased pork imports.
SCMP reports that China's year-over-year pork imports increased to 150 percent in November. And according to Bloomberg, China's pork imports rose over 75 percent in 2019. This is a new record high, with shipment reaching up to 2.11 million tons.
The table below shows Chinese pork imports in tons from 2016 to 2019.
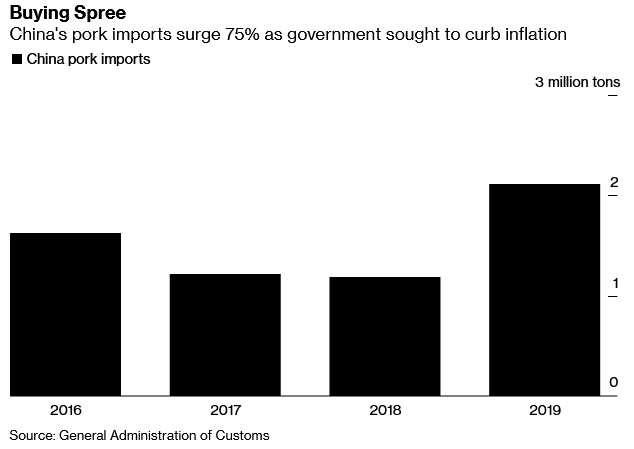
| Year | Pork Import (tons) |
|---|---|
| 2016 | 1.62 |
| 2017 | 1.22 |
| 2018 | 1.19 |
| 2019 | 2.11 |
The table shows figures in tons representing figures from China's pork imports from 2016-2019.

Going into the trade war, China had an advantageous trade balance which made them prone to the impact of tariffs. Because of this, the U.S. was able to impose tariffs on hundreds of billions of exports from China.
According to BBC, President Donald Trump's policy aims to urge consumers to buy American products, making imported commodities more expensive. The report also states that the U.S. has enforced tariffs on over $360 billion Chinese products. In response, China imposed tariffs on more than $110 billion U.S. products.
The BBC timeline below provides a brief summary of the U.S.-China trade war from July 2018 to December 2019.
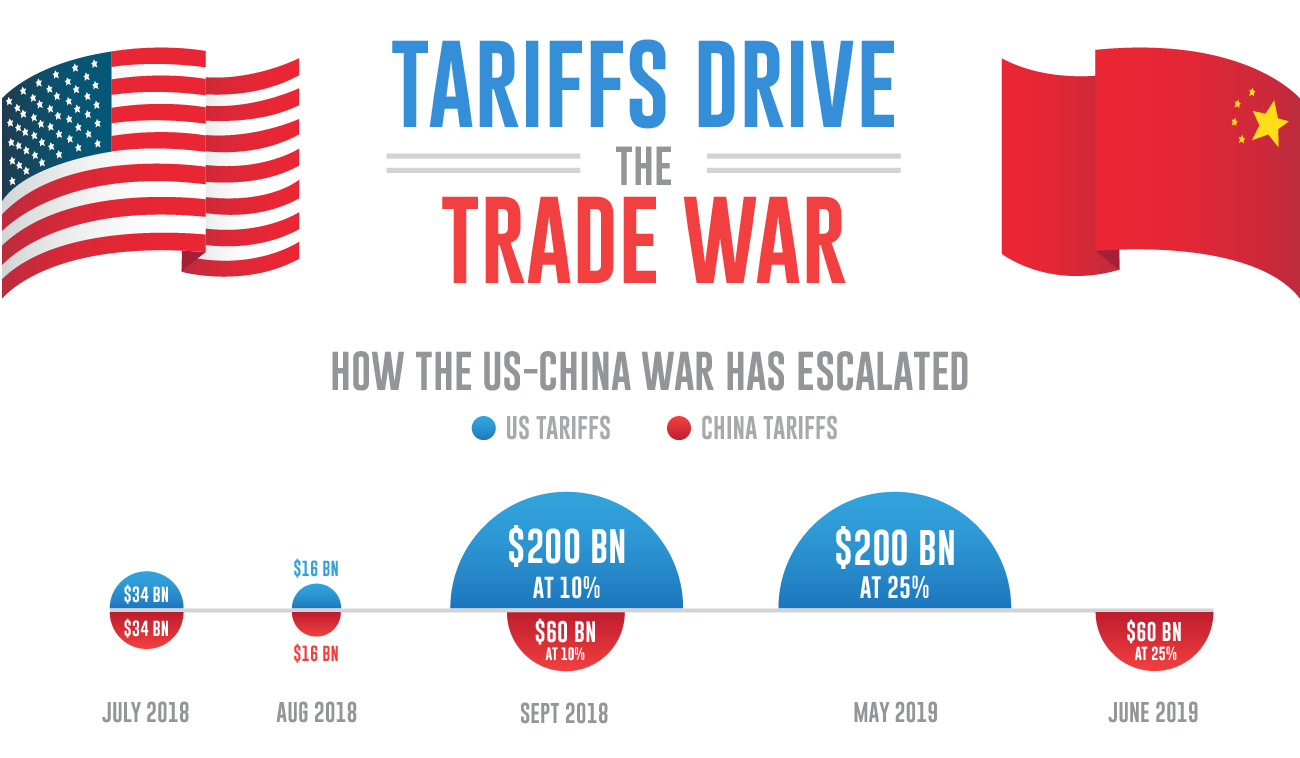
In January 15, 2020, U.S. and China signed a deal to ease the trade war. Under phase one of the agreement, China pledged to increase U.S. imports, as well as improve its intellectual property laws. In response, the U.S. agreed to cut tariffs in half for some Chinese products. The second phase of the agreement is due to discuss more issues, but nothing definitive has been announced.
In April 2018, SCMP reports that ZTE Corp., the largest telecom equipment maker and the company behind Huawei, was found guilty of shipping U.S. technology to Iran. In December 2018, the Guardian reported that Huawei's chief financial officer, Meng Wanzhou, was arrested in Canada for allegedly making false statements about selling equipment to Iran.
These events prompted the U.S. government to ban sales by American companies to ZTE Corp. The restriction cripples China's ZTE exports and sales to the company by U.S. suppliers by seven years.
The U.S. Attorney General William Barr suggested the United States and allies should invest in Nokia and Ericsson to counter Chinese 5G telecom dominance.
Luis-Vincent Gave compared fiber optic cable and semiconductors today to oil and the 1956 Suez Crisis which led to Britain losing influence across the Middle East.
Will the coming decades still be the age of the container-ship? Possibly not, for the simple reason that things that have value increasingly no longer travel by ship, but instead by fiberoptic cables! In the world of tomorrow, it will not be the tennis shoes, cotton underwear, or even automobiles slowly moving from one continent to the next on big hulks of steel that need protection from raiders. Instead, it will be the zeros and ones zipping at the speed of light through network switches.
The rising pork costs made it difficult for China to lower interest rates which would stimulate economic growth. China's consumer price index rose to 3.8 percent in October, which is the highest since January 2012. That's more than a 100 percent increase.
In September 2019, Reuters reported that China will exempt some agricultural products from added tariffs on U.S. goods. The news notes that the U.S. and China have both made ‘reconciliatory efforts,' which renewed buying of U.S. agricultural goods and delayed tariff increases on certain Chinese products. In November 2019, China also ended a ban on U.S. poultry imports to curtail their meat shortage.
Prior to the exemption, the report states that China set a 12 percent tariff on pork products. During the trade war, they enforced three rounds of additional tariffs to U.S. pork. China raised the tariff from 25 percent to 37 percent in April 2018. By July 2018, they increased it by 25 percent, imposing 62 percent tariff. And in September 2019, they added 10 percent, making the tariff as high as 72 percent.
The United States stock markets are making record highs while China has been backsliding.
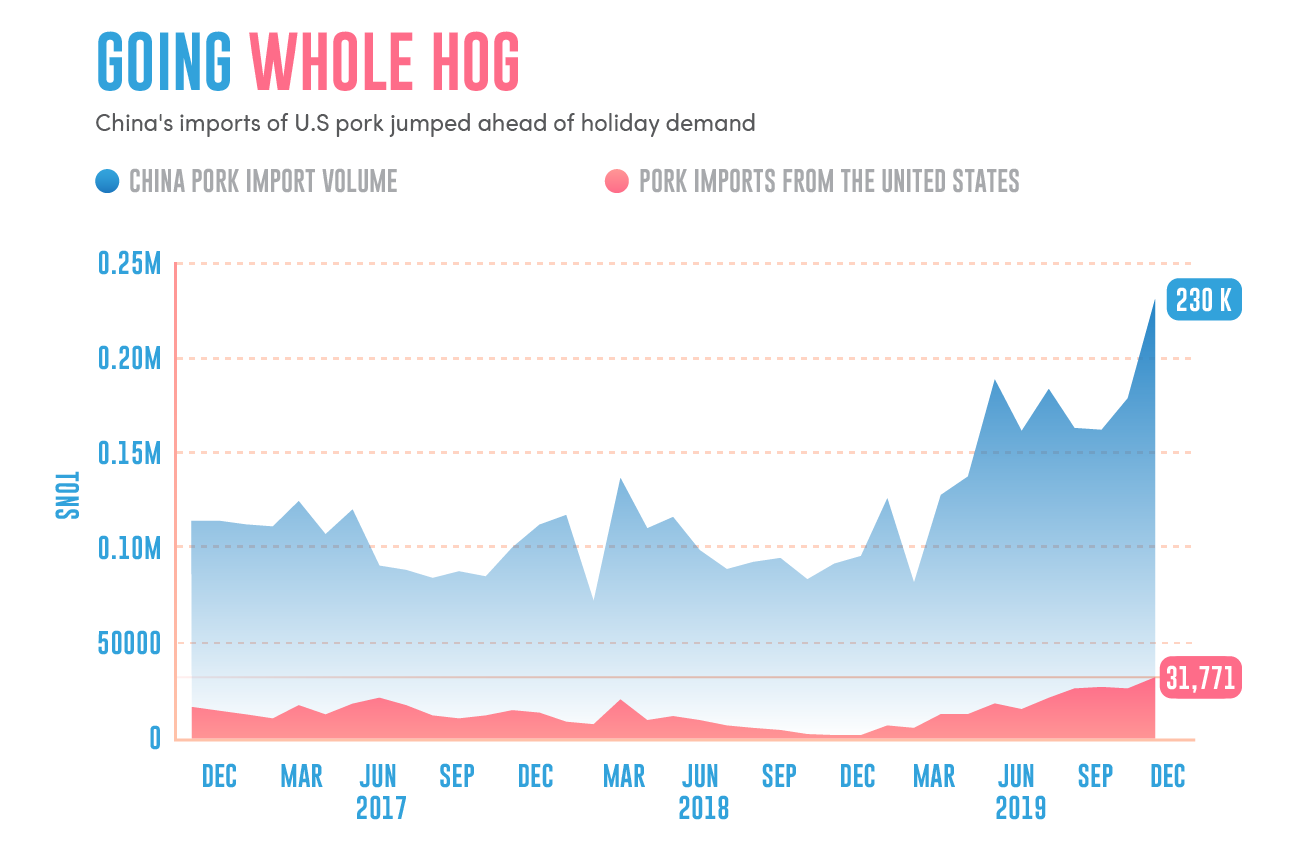
Despite the increasing tariffs, USDA data shows that 26.5% of U.S. pork exports went to China in November 2019. This is a huge rise from 4.9 percent in 2018.
In December 2019, China dropped all tariffs on U.S. pork. This is shortly after releasing 40,000 tons of pork from their emergency reserves. Bloomberg's graph below shows how China had to boost pork imports from the U.S. in spite of the on-going trade war.
The Washington Examiner featured Ohio farmers who have high hopes for phase one of President Trump's trade deal with China. According to the report:
“About 26% of American pork is exported. Getting deeper into Chinese markets and pushing that number to 30 would not only help farmers stay in business but would roll back the trade deficit with Beijing.”
And as part of the phase one deal, China agreed to purchase another $12.5 billion in agricultural goods from the U.S. in 2020, and $19.5 billion in 2021. China pledged to buy $200 billion worth of goods in the next two years, with $32 billion being pork products.
Even after singing the first trade agreement, WSJ reported that the U.S. has retained tariffs on around $370 billion of Chinese exports. However, they also agreed to cut the tariff rate from 15 percent to 7.5 percent on some Chinese goods. President Trump expressed he is open to removing tariffs if both countries can agree on widespread economic policy changes in phase two of the negotiations.
"Growth in global trade sank to a meager 1% last year, down from 4% in 2018 and 6% in 2017. It was the fourth worst showing in 40 years, and the worst ever outside a period of recession, according to International Monetary Fund data. Several factors contributed to the slowdown, but analysts say the U.S.-China trade war was the single-biggest cause." - WSJ
After China's ASF crisis, the U.S.-China trade truce inevitably made China ease tariffs on U.S. imports, especially on pork. However, the U.S. still has substantial tariffs on Chinese goods in place.
This is a sign that President Trump clearly won the upper hand in trade negotiations. For the time being, most tariffs on Chinese products will remain, that is until China is ready to negotiate a much better trade deal with the U.S. For now, China continues reducing tariffs on vital imports from the United States with additional removals announced after the phase one trade deal.
“China announced Thursday it will cut tariffs on $75 billion of U.S. imports by half, starting next week. In a statement, China's Ministry of Finance said 10% tariffs on some U.S. goods would be cut to 5%, while other goods that have faced 5% levies will have those cut to 2.5%, starting at 1:01 p.m. Feb. 14, Beijing time.”
In spite of China backing off from tariffs the United States is still pressing forward with...
President Trump's approval is at all time highs and is above where President Obama's was at this point in his first term.
Trump won, again!

Jose Abuyuan is a web content writer, fictionist, and digital artist hailing from Las Piñas City. He is a graduate of Communication and Media Studies at San Beda College Alabang, who took his internship in the weekly news magazine the Philippines Graphic. He has authored works professionally for over a decade.